18. 03. 2025
Icinga Web 2, ITOA, NetEye, UI, Unified Monitoring

22. 03. 2022
Juergen Vigna
ITOA, NetEye, Unified Monitoring
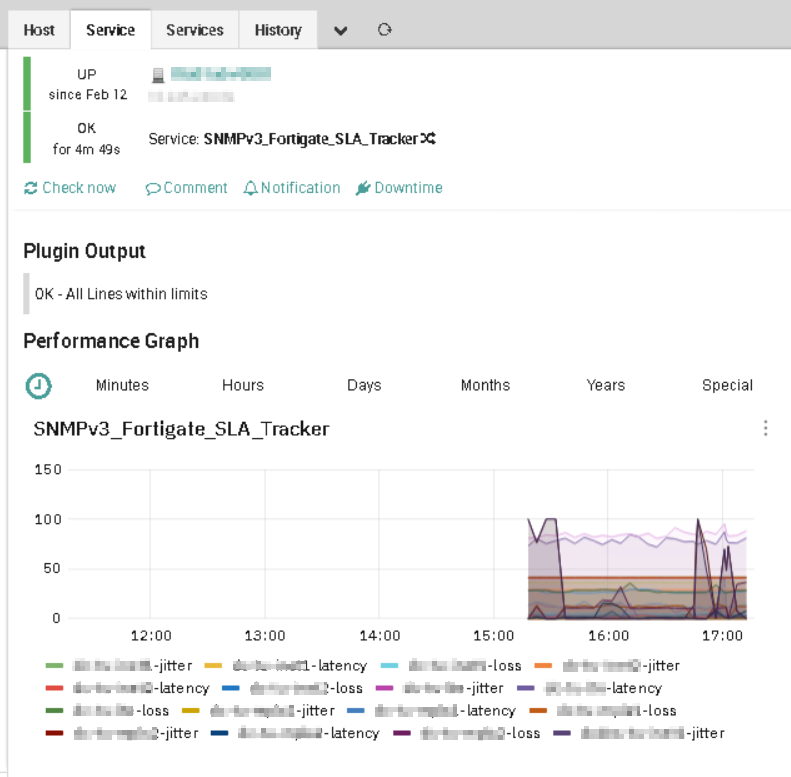
Monitoring Fortigate Firewall SLA Trackers
Recently a customer told me he would like to monitor and graph the values that his Fortigate Firewall was generating for his configured SLA Trackers. What are these SLA Trackers? I informed myself and found the following in a Fortigate Cookbook.
Fortigate Performance SLA ─ Link Monitoring
Performance SLA link monitoring measures the health of links that are connected to SD-WAN member interfaces by sending probing signals through each link to a server, and then measuring the link quality based on latency, jitter, and packet loss. If a link is broken, the routes on that link are removed, and traffic is routed through other links. When the link is working again, the routes are then re-enabled. This prevents traffic being sent down broken links and thus lost.

In the example above:
- Interfaces wan1 and wan2 connect to the internet through separate ISPs
- The detection server IP address is 199.199.199.199
A performance SLA is created so that, if one of the two links fails, its routes are removed and traffic is detoured to the other link.
Getting Data for Fortigate SLA Trackers
Configuring such trackers will produce basically 3 values:
- Network Latency
- Network Jitter
- Network Loss
This data can be queried from the device using SNMP (on the Fortigate it’s SNMPv3) and using the following base OID: 1.3.6.1.4.1.12356.101.4.9.2.1
Starting from there you have to walk various trees to get the correct and complete data:
- 1.3.6.1.4.1.12356.101.4.9.2.1.2: This is the location identifier for which various interfaces are used as in the example above
- 1.3.6.1.4.1.12356.101.4.9.2.1.14: This is the interface name OID, and has to be used together with the location identifier to obtain a unique identifier
- 1.3.6.1.4.1.12356.101.4.9.2.1.5: Latency value for any location/interface pair
- 1.3.6.1.4.1.12356.101.4.9.2.1.6: Jitter value for any location/interface pair
- 1.3.6.1.4.1.12356.101.4.9.2.1.9: Loss value for any location/interface pair
With this knowledge it was quite easy to write a small plugin to use with the Icinga 2 instance in our NetEye Server. You can download the code for the plugin here: check_snmp_fortigate_sla_tracker.pl
Now you just have to get the values you need for the SNMP connection to your firewall (protocols 1, 2c and 3 are supported), and then call it like this:
check_snmp_fortigate_sla_tracker.pl -H <myfirewallip> -C <myfirewallcommunity> -w 100,30,20 -c 500,100,60
The Warning and Critical parameters are a triple of latency, jitter, loss. Any reported values from any of the interfaces must be below these configured values in order to not trigger a warning/critical event.
These Solutions are Engineered by Humans
Did you read this article because you’re knowledgeable about networking? Do you have the skills necessary to manage networks? We’re currently hiring for roles like this here at Würth Phoenix.

Juergen Vigna
NetEye Solution Architect at Würth IT Italy
I have over 20 years of experience in the IT branch. After first experiences in the field of software development for public transport companies, I finally decided to join the young and growing team of Würth Phoenix (now Würth IT Italy). Initially, I was responsible for the internal Linux/Unix infrastructure and the management of CVS software. Afterwards, my main challenge was to establish the meanwhile well-known IT System Management Solution WÜRTHPHOENIX NetEye. As a Product Manager I started building NetEye from scratch, analyzing existing open source models, extending and finally joining them into one single powerful solution. After that, my job turned into a passion: Constant developments, customer installations and support became a matter of personal. Today I use my knowledge as a NetEye Senior Consultant as well as NetEye Solution Architect at Würth Phoenix.
Author
Latest posts by Juergen Vigna
22. 05. 2025
NetEye, Unified Monitoring
Automatic Integration of NagVis Map into Icinga Web 2/NetEye Monitoring