
With NetEye 4.22 we released a feature awaited for years: the ability to reach the Elasticsearch API externally, thanks to our NGINX proxy under NetEye.
This new feature brings with it a lot of use cases, but what was turning over and over in my head was the automatic process for verification of the blockchains made by the Elastic Blockchain Proxy (EBP), or just El Proxy between friends.
The main focus and scope of the EBP is compliance with the GDPR, obviously, but there’s more to it than that. Keep in mind that in NetEye, admin users have full rights and control over all the logs, checks, and results in the NetEye ecosystem. This means that an admin user can delete or manipulate a document/log or monitoring check result without any checks on that capability.
The EBPs permit the creation of a parallel chain for specific ingested logs or documents that fixes this loophole, because only those people who have the Master Key of the blockchain can manipulate these documents. And this is usually the Data Protection Officer (DPO).
So what do we need to set this up?
- A CentOS 7 minimal release
- Access to the NetEye repository from this machine
- Ability to reach NetEye VIP on port 9200 (Elasticsearch API) and port 443 (Tornado Webhook)
For the detailed procedure to install the external machine you can follow the NetEye User Guide.
The result is a new host along with a passive check on NetEye Overview, with OK or WARNING based on the exit status code of the Verify Service on the external machine. This is useful, but as a user I would like to have more information about any eventual errors.
I looked more deeply at the product script and I found a quick-win solution to answer these questions:
- Can I see the output and any errors of the Verify process inside Icinga Overview?
- Can I set a service check on each blockchain I see in Icinga Overview?
- How can I manage multi-tenancy environments?
- Can I have a dashboard to manage and see all EBPs logs and actions?
New script refactoring
After analyzing the architecture I found that the first three goals could be easily reached in just 2 steps:
- Modify the script in the User Guide as attach below:
/usr/local/bin/elproxy_verify_blockchain_and_send_result
#!/bin/sh

TENANT="$1"
RETENTION="$2"
TAG="$3"
WEBHOOK_COLLECTOR_HOST="$4"
WEBHOOK_TOKEN="$5"

#/usr/bin/elastic_blockchain_proxy verify --key-file "/root/elastic-blockchain-proxy/keys/elproxysigned-${TENANT}-${RETENTION}-${TAG}_key.json" --index-name "*-*-elproxysigned-$TENANT-$RETENTION-$TAG-*" --elasticsearch-authentication-method pemcertificatepath --elasticsearch-client-cert /root/elastic-blockchain-proxy/certs/ebp_verify.crt.pem --elasticsearch-client-private-key /root/elastic-blockchain-proxy/certs/private/ebp_verify.key.pem
#/usr/bin/curl "https://$WEBHOOK_COLLECTOR_HOST/tornado/webhook/event/elproxy_verification?token=$WEBHOOK_TOKEN" -d "{\"exit_status\": \"$?\"}"


ERROR=$(/usr/bin/elastic_blockchain_proxy verify --key-file /root/elastic-blockchain-proxy/keys/elproxysigned-${TENANT}-${RETENTION}-${TAG}_key.json --elasticsearch-authentication-method pemcertificatepath --elasticsearch-ca-cert /root/elastic-blockchain-proxy/certs/root-ca.crt --elasticsearch-client-cert /root/elastic-blockchain-proxy/certs/neteye_ebp_verify_master.crt.pem --elasticsearch-client-private-key /root/elastic-blockchain-proxy/certs/neteye_ebp_verify_master.key.pem --index-name=*-*-elproxysigned-${TENANT}-${RETENTION}-${TAG}-* 2>&1 >> /var/log/ebp/elproxysigned-${TENANT}-${RETENTION}-${TAG}.log)

EXIT=$?

ERROR=$(echo $ERROR | sed 's/\"/\\"/g')

if [ -z "$ERROR" ]
then
   OUTPUT="Verification successful."
else
   OUTPUT=$ERROR
fi

/usr/bin/curl -k "https://$WEBHOOK_COLLECTOR_HOST/tornado/webhook/event/elproxy_verification?token=$WEBHOOK_TOKEN" -d "{\"exit_status\": \"${EXIT}\",\"name\": \"elproxysigned-${TENANT}-${RETENTION}-${TAG}\",\"output\": \"${OUTPUT}\"}"
- Configure a more complex Tornado Rule to create a different host based on the tenant’s name and with the result on the Plugin Output
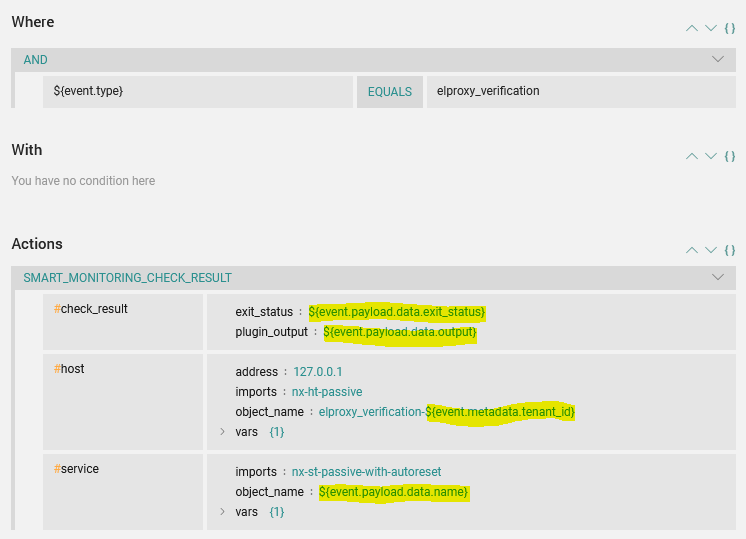
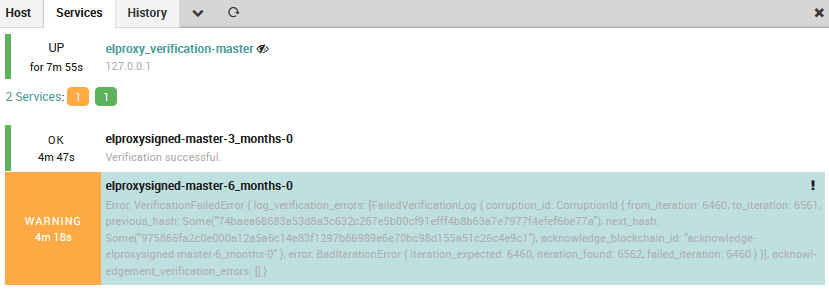
The result is host and services in Icinga Overview as in this screenshot:
Retrieve all logs from the Verify process and show them in a dashboard
The last interesting question is how to show logs from the El Proxy Verify process in a dashboard on our Log analytics, where the DPO can run any desired search on historical data and, why not, also create a report.
To the script above we’ve added a redirect from a bash command to a log file under /var/log/ebp/
Here each file represents logs belonging to a single Blockchain, just like the SystemD Service that is also one each.
These logs can be read by a Filebeat instance installed on the external machine that parses and sends events directly to Elasticsearch on NetEye. It’s important that these logs NEVER pass through the logstash instance, which is under the control of NetEye admins, to avoid any possible manipulations.
Due to the complicated concepts behind the Kibana RBAC and multi-tenancy, here I’ll only list the steps needed to reach our goal:
- Add a specific role for DPO Users on NetEye
- Create a dedicated space linked to the DPO Role
- Log in with a DPO User and generate a new API Key for Filebeat
The final Filebeat configuration on the external machine should look like this:
output.elasticsearch:
  # Host of NetEye VIP to connect to.
  hosts: ["@NETEYE_VIP@:9200"]
  index: "verify-%{[ebp][name]}"
  pipeline: "filebeat-ebp-pipeline"
  # Protocol - either `http` (default) or `https`.
  protocol: "https"

  # Authentication credentials - API key from Kibana
  api_key: "@API_ID_FROM_KIBANA@"
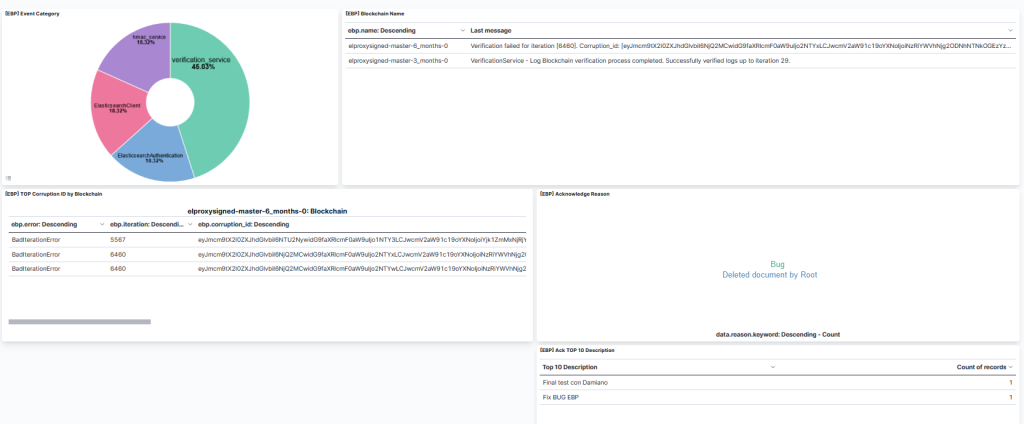
The result is a dashboard like the one shown in the image below, which we can customize as we prefer. For example here I have also added a dedicated block for Acknowledged actions, which are those made by the DPO to fix a broken blockchain.
Conclusions
We’ve managed to get a good result: checks shown in Icinga Overview, along with a Dashboard to navigate data on Kibana. Wonderful, but from a security point of view this is not enough. Even as I’m writing this blog I can see other issues affecting our solution. And the potential attacker is the same every time: those pesky NetEye admins!
A quick list:
- The
filebeat-ebp-pipelinecan be modified by NetEye Admins - The
verify-*indices can be deleted or manipulated by NetEye Admins - The hosts and services on Icinga Overview can be manipulated by NetEye Admins
So I suggest that you invest the appropriate time and effort needed to make sure that the people on NetEye have the right roles and permissions: MINIMUM PRIVILEGES is the best way to protect your systems.


Enrico Alberti
I’ve always been fascinated by the IT world, especially by the security environment and its architectures.
The common thread in my working experience is the creation of helpful open-source solutions to easily manage the huge amount of security information.
In the past years, my work was especially focused on Cyber Kill Chain, parsing and ELK Stack but in order to start from the beginning...
In 2010 I left my birthplace, the lovely Veneto, looking for a new ´cyber´ adventure in Milan. After graduating in Computer Systems and Networks Security, I worked for 6 years as a Cyber Security Consultant.
During the first 5 years, I explored the deep and manifold world of cybersecurity, becoming passionate about open source solutions. After that, I decided to challenge myself joining a Start-up company focusing on SOC services (I’m a proud member of the Blue Team!).
In Wuerth IT Italy, I would like to personalize the NetEye System for each one of our customers, in order to develop the perfect product for their needs, by combining all my past experiences and skills.
Author
Latest posts by Enrico Alberti
28. 12. 2023
Log Management, Log-SIEM, NetEye
Monitor Fleet Elastic Agents with NetEye Extension Packs (NEP)
28. 10. 2022
Log Management, Log-SIEM, NetEye
Syslog Collection with Elastic under Distributed NetEye Monitoring
19. 07. 2022
Contribution, NetEye, Unified Monitoring
Integration of Centreon Plugins into NetEye Extension Packs
24. 12. 2021
Log Management, NetEye
Log Management through NetEye Satellites