Monitor Fleet Elastic Agents with NetEye Extension Packs (NEP)
With the latest version of NetEye 4.33, the Fleet Server and ElasticAgent officially join the NetEye Elastic Stack (see NetEye 4.33 Release Notes )
Related to this new big feature, within the NetEye Extension Packs project we have provided new monitoring checks that can help customers and consultants who use NetEye to keep these new elements under control.
Let’s look at them together!
How many ElasticAgents have been deployed in the whole environment?
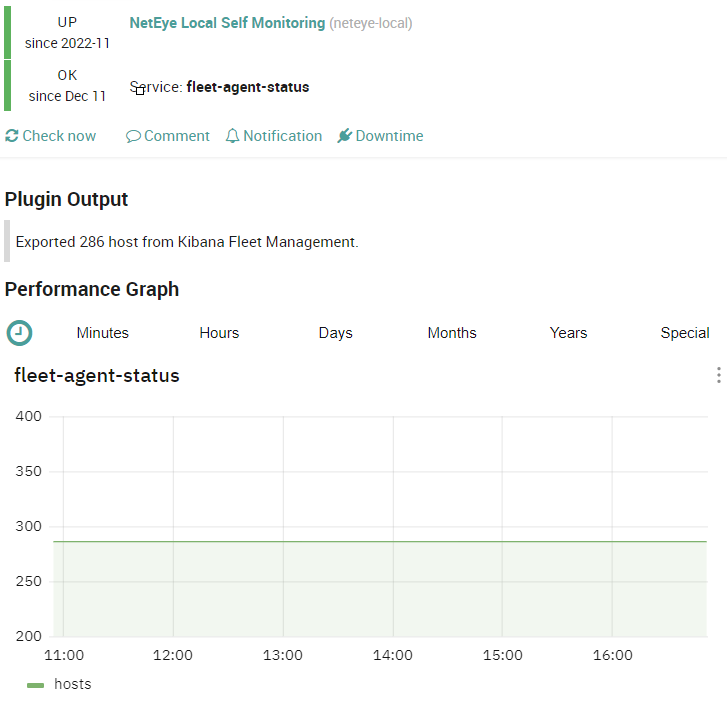
The fleet-agent-status exports every 5 minutes the total number of Elastic Agents found with the specific Fleet APIs. The result is automatically saved into a shared file named elastic-agent_status.json located in /neteye/shared/icinga2/data/lib/icinga2 and the total number of agents is showed as performance data.
F.Y.I.: At the moment the check doesn’t have a threshold range on the number of hosts returned, if you think that could be interesting tell us the use-case and we can develop it. 🙂
How to check all the Agent instances on a cluster or multi-tenancy deployment?
Related to the check above, we have also released a Service Set (nx-ss-neteye-endpoint-elastic-agent-state) that lets you monitor ElasticAgent instances installed on each NetEye endpoint objects, like Cluster Nodes or Satellites.
With this Service Set you’ll add the following 2 services:
- Elastic Agent Status: this service checks on files generated with service
fleet-agent-status(see previous paragraph) the current status of ElasticAgent installed on that endpoint.
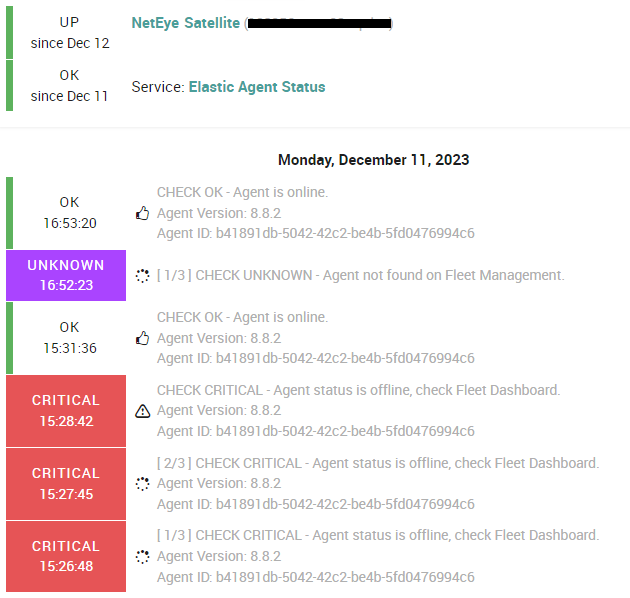
Keep in mind: this service check the communication is correct between Agent and Fleet Server, NOT the communication between agents and their outputs (Elasticsearch or Logstash).
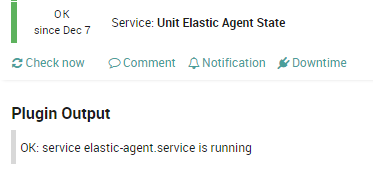
- Unit Elastic Agent State: this service checks the correct running of the SystemD service
elastic-agenton the NetEye endpoint.
Can I automatically monitor a newly added ElasticAgent and/or Data Source that send logs to the Elasticsearch?
Answering these questions is a challenge that begins with the old Beats agents, and finally we have now found a correct way to handle them (or so we hope).
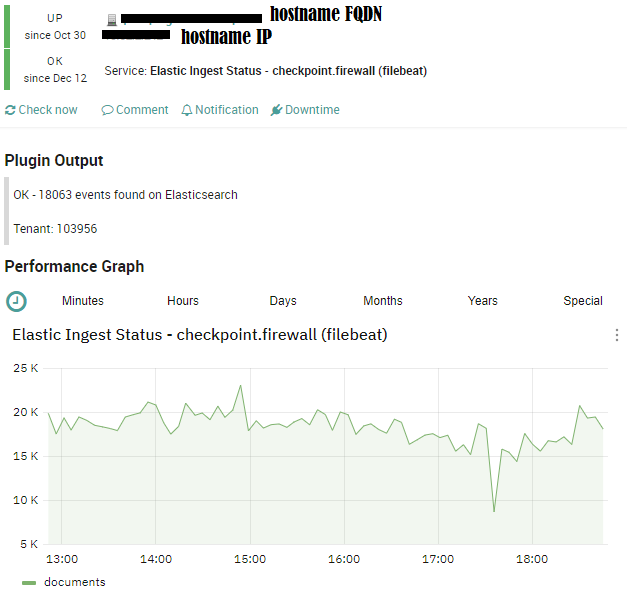
check_elastic_dataset_status.py is the new plugin that retrieves from Elasticsearch all the logs that are received in a time range grouped by specific fields: tenant, NETEYE.hostname, agent.type and event.dataset (each log that comes in NetEye SHOULD have these).
The plugin returns the total number of logs founded on the specified tenant (optional parameter) or across all tenants.
To automatically monitor each data source that sends logs to our environment, the plugin also sends a bunch of webhooks to the Tornado Webhook Collector.
The collector passes to the Tornado Engine the document where there is a specific ruleset that is responsible of the creation of services in the corresponding NetEye Object. The outcome is like what you can see in this image:
By default with NEP, the following two checks are provided:
- Elastic Dataset Status – Master main tenant present on each system
- Elastic Dataset Status – neteye_system_internal new tenant, introduced to collect all interesting logs from NetEye Environment like: system access logs, Elasticsearch server log, Logstash instance logs, and EBP logs.
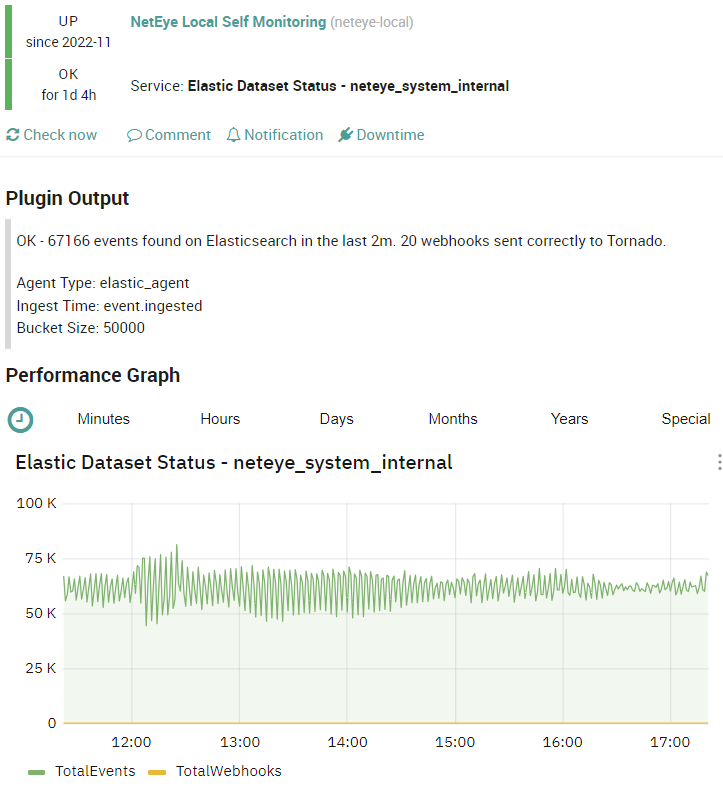
Keep in mind: Due to the automatic mechanism of this check, we have excluded from the ES Query all those logs that have the tag neteye_object_not_found. This tag will be attached to the logs if their host names are not correctly found or set in Icinga Director.
We’re really happy to receive feedback and new ideas on how to improve our NetEye Extension Packs; you can open a ticket on our Customer Portal or interact with the Online Resources.
These Solutions are Engineered by Humans
Did you find this article interesting? Does it match your skill set? Our customers often present us with problems that need customized solutions. In fact, we’re currently hiring for roles just like this and others here at Würth Phoenix.


