30. 06. 2026
Azure, Cloud, Microsoft, NetEye, NetEye Extension Packs, Unified Monitoring

Sometimes you’d just really like to have an overview of what happens to the Events that flow through Tornado. Where do they come from? Did they get stuck somewhere in the Collectors or in Tornado? Which Tornado Actions did they trigger?
Gathering all this information from hundreds of log lines across different services (i.e., Tornado and Tornado Collectors) can easily give you a big headache. The reason is that logging is great for showing what happened at any instant during program execution, but it’s not the best tool for showing the flow of an Event in the program.
This is where Distributed Tracing and the Tornado Elastic APM integration can come to our aid.
The implementation of Distributed Tracing in Tornado allows us to track an Event through the entire sequence of end-to-end computations across different services. The integration with Elastic APM allows us to have an overview on the flow of the Events and provides highlights on the performance of Tornado and its Collectors.
The following video shows how Elastic APM allows us to easily explore the flow that an Event followed in Tornado.
APM shows us that the Event was created by a Webhook Collector, and also gives us useful information on the important characteristics of the Webhook itself and about the caller of the Webhook. Then we can see that the Event was passed to Tornado, we can navigate through the Filters it matched and through the Actions that were triggered. For each Action we also have some insight into the parameters of the Action and we can see whether the execution of the Action was successful or not.
If we are interested in investigating bottlenecks in the processing of the Event, APM of course also shows us how much time it took to carry out the Action execution and all the other parts of Event processing. This can be very useful for instance to see what happened to Action Executions during Tornado’s execution retries.
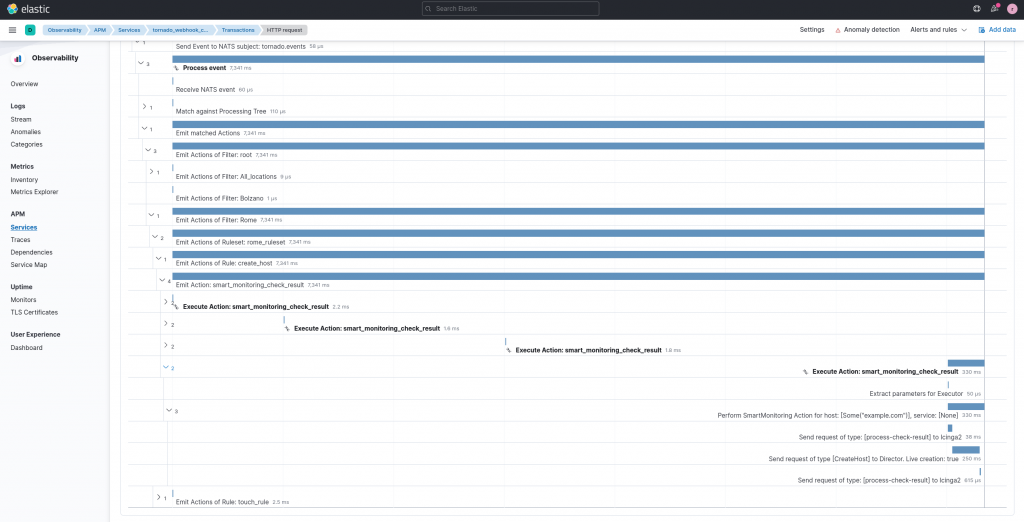
In the screenshot below Elastic APM shows us what happened to a smart_monitoring_check_result Action which occurred during a restart of Icinga 2. From the span graph we can immediately see how many times the action was retried (4 times in this case), and how long it took before the Action was successfully executed (7.3 seconds in this case). Understanding all this information about Tornado retries from Elastic APM will take around 5 seconds, even for admins with only very basic knowledge about how Tornado works. You can imagine that inspecting all of this by reading the logs instead is nowhere near as easy as it is with Elastic APM.
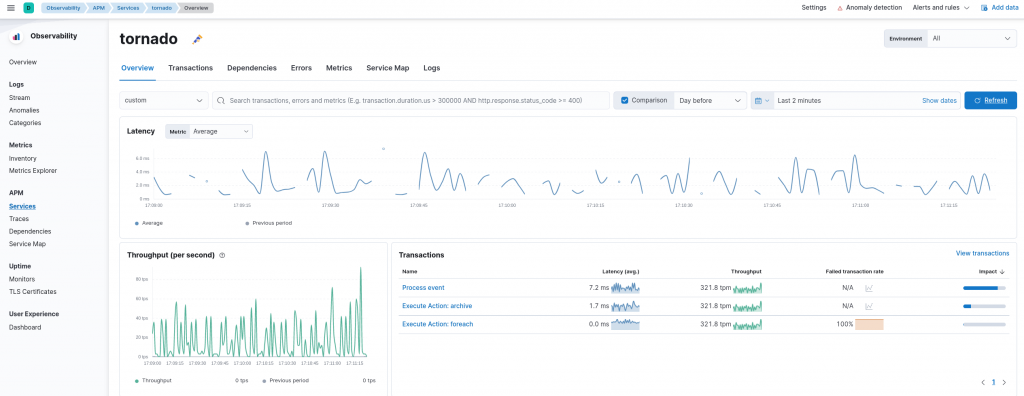
If you’re interested instead in the overall performance of Tornado rather than tracing single Events, in Elastic APM you can also find overviews on the performance of the Tornado and Tornado Collector services, as you can see below.
In this blog post I showed what we’ve achieved with Elastic APM integration in Tornado. In upcoming posts we’ll go deeper into the details of the tracing implementation, how OpenTelemetry enabled Distributed Tracing, and the integration with Elastic APM.