22. 05. 2026
AI, NetEye, Unified Monitoring

NetEye provides its users with the GeoMap module, and recently a customer asked me to prepare a useful GeoMap configuration for him, so he could geographically locate the backbone devices in his network.
The NetEye Geo Map module allows you to overlay the position and status of hosts on top of a customizable map, based on OpenStreetMap.
The advantages regarding the use of GeoMap can be traced back to the speed in which the state of a device being monitored can be detected and overlaid with respect to the geography of where it’s physically located. A tool like this is very useful in a control room, returning at a glance the health status of the object being monitored along with where it’s physically located, in case for example you need to physically replace a device.
Using GeoMap
Let me start by describing how to configure the GeoMap module within NetEye.
You’ll need to consult the GeoMap Menu as shown in the image below:
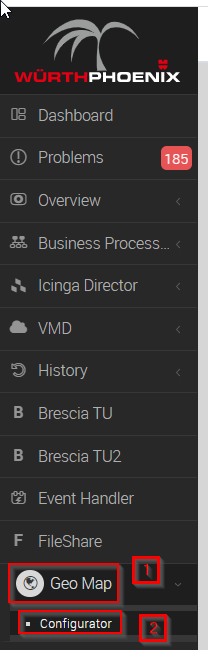
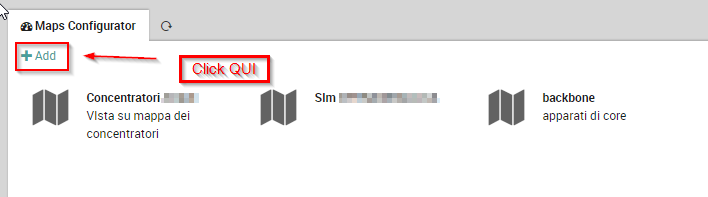
After clicking on Configurator, next click the icon bearing the words + Add. See for example:
At this point you’ll need to provide the correct information as in the example below:
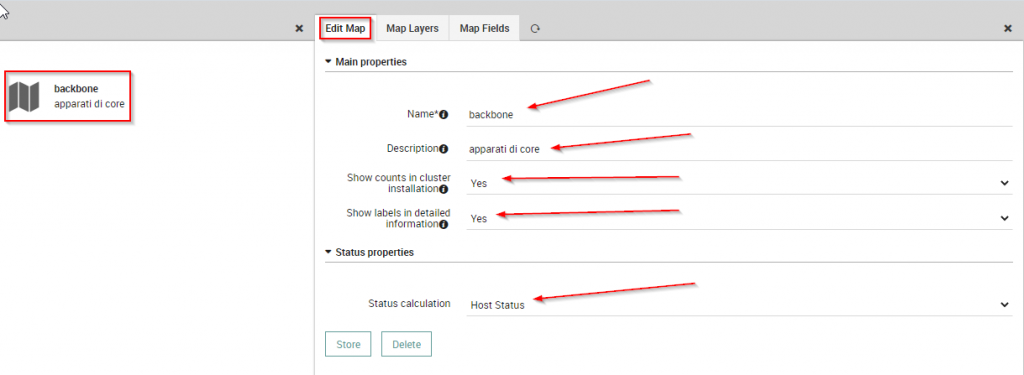
where:
- the Name field should be the name that will be assigned to the Map
- Description is useful for giving a brief description of it
- the third field from the top, on the other hand, is configured with a convenient drop-down menu useful for aggregating monitored objects in the same Geo location
- while the fourth field is useful for displaying labels in the detail information
- the last field instead, the Status Calculation, is used to indicate that the status of the object being monitored should be displayed on the map
Now let’s switch to the Layer configuration as shown in the image below:
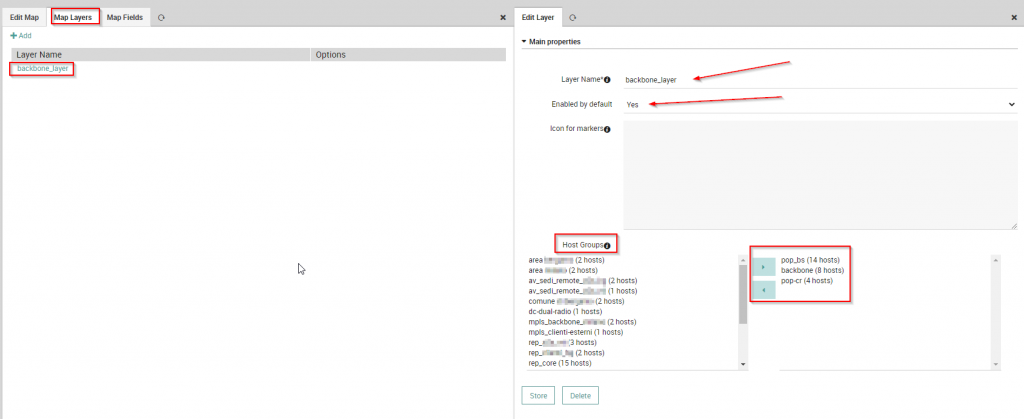
Where:
- Layer Name is used to name the Layer (it’s usually convenient to name it with a reference to the map name, in this case backbone)
- Host Groups let you group monitored objects as they are configured in NetEye: just highlight them in the box at the left and, by means of the arrows buttons, add them to the box on the right.
At this point you need to configure the Map Fields, which are useful for defining the information that will be added along with the GeoMap you are configuring:
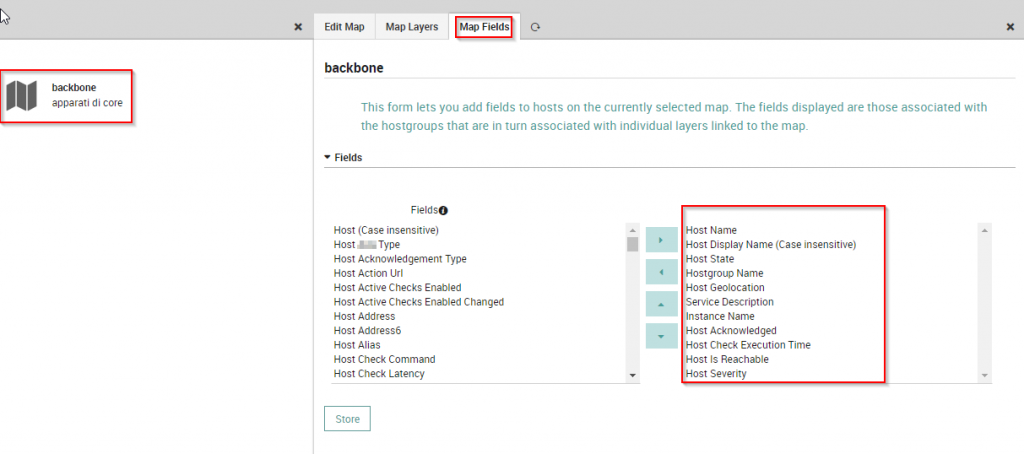
Again, to select fields, highlight them from the box at the left, and include them in the box at the right.
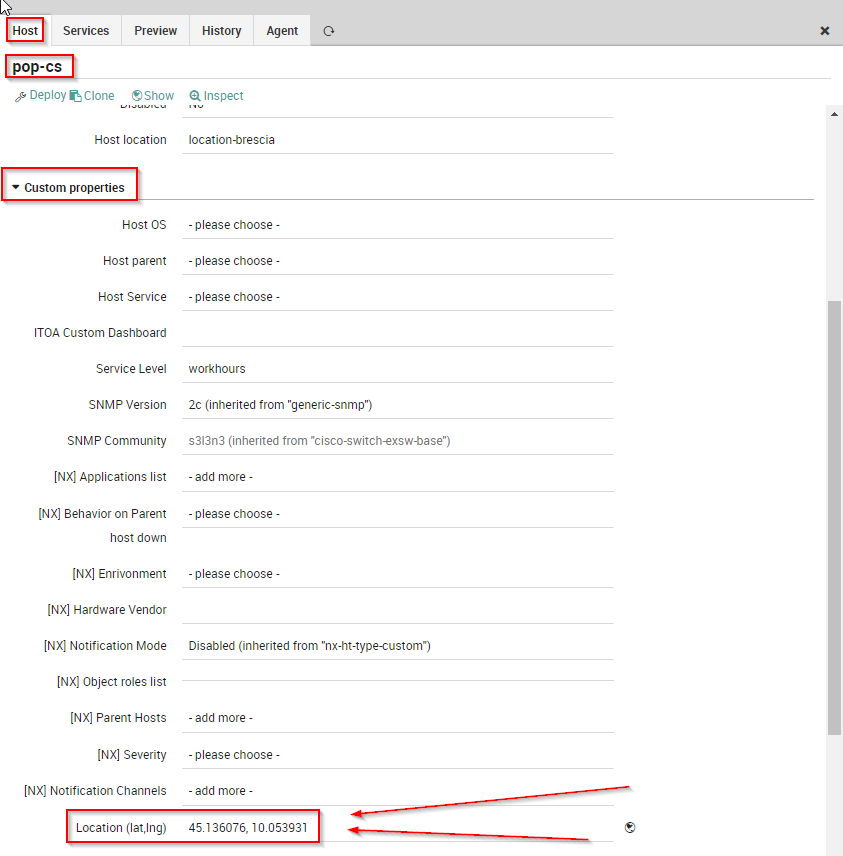
At this point the objects to be included in the GeoMap must be accompanied by their GPS coordinates in order to be correctly positioned on the GeoMap being created:
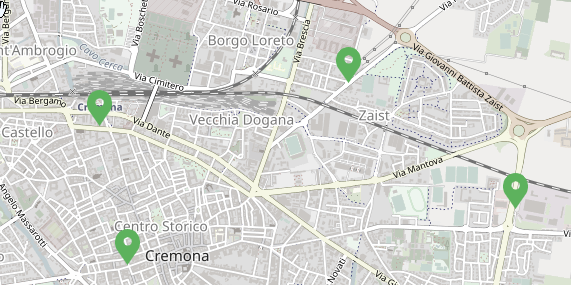
The result of the configuration we’ve completed so far will be as follows:
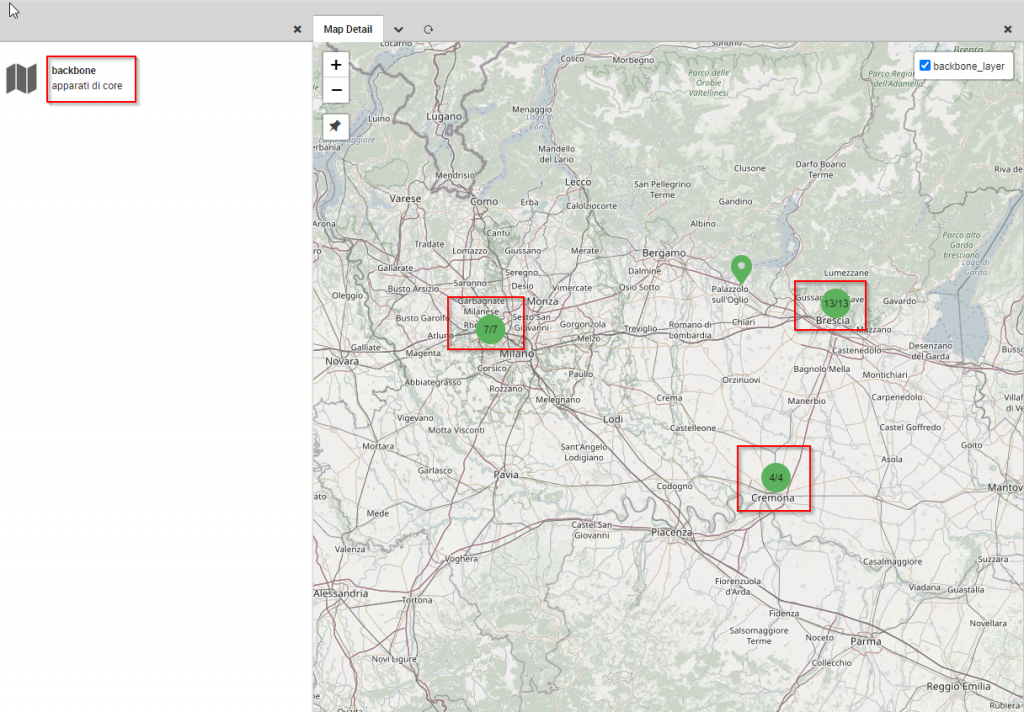
Objects grouped by Host Group are aggregated on the basis of GPS coordinates, and the counts are given for each Geographic location. The color links back to the status of the devices themselves, so for each grouping you can click on a group as shown here:
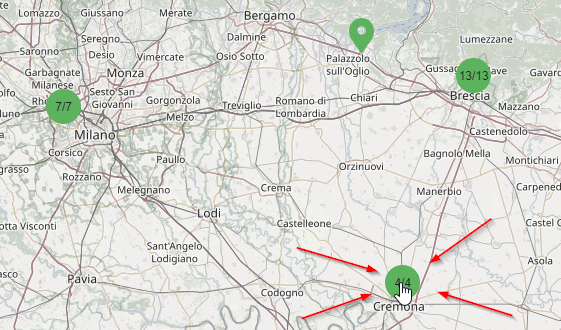
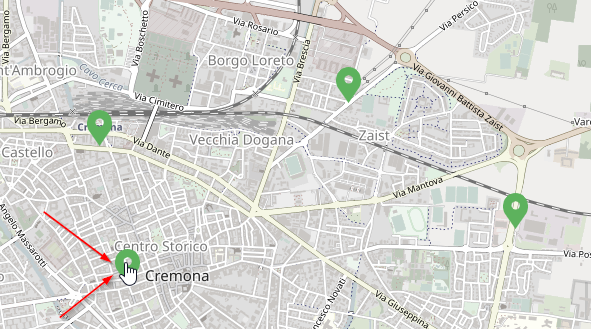
And then the location will be “exploded” to show each host individually as in this screenshot:
And if you then click on a single object:
Then any details defined in the Fields we previously configured will now be displayed:
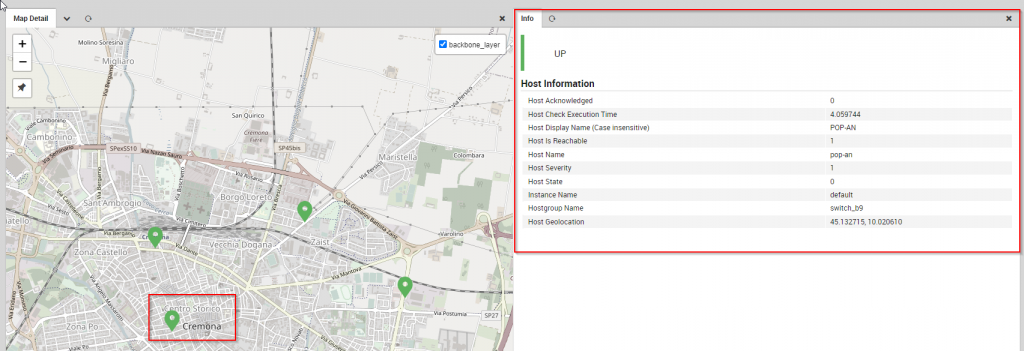
As you can see, drilling down is allowed down to individual objects shown in GeoMap.
These Solutions are Engineered by Humans
Did you read this article because you’re knowledgeable about networking? Do you have the skills necessary to manage networks? We’re currently hiring for roles like this as well as other roles here at Würth Phoenix.
Giovanni Davide Saccá
Hi all, my name is Davide and I was born in San Donato Milanese. Since I was a boy I've always been intrigued by PCs, and so I took my first steps with my Commodore VIC-20. Before joining Würth Phoenix as an SI consultant, I worked first as a Network Engineer for several ISPs (Internet Service Providers) in the late 90s, then for the first ASP (Application Service Provider) and next as a head of IT Network and Security. My various ITIL and Vendor certifications have allowed me to be able to cooperate at multiple project levels. I like tennis, music, motorcycles and going on nature walks with my family.
Author
Latest posts by Giovanni Davide Saccá
15. 02. 2023
Unified Monitoring
Ntopng and Behavior Analysis
15. 02. 2023
NetEye, Unified Monitoring
Grafana: InfluxDB Query to Extract More Than a Single Metric in a Single Panel