
27. 06. 2024
Giuseppe Di Garbo
ITOA, NetEye, Unified Monitoring
Streamlining Icinga Director with Grafana
Icinga Director is a powerful configuration tool included in NetEye that streamlines the process of defining and managing monitoring configurations. However, you may encounter issues with duplicate addresses and spaces in hostnames, which can lead to confusion and monitoring inaccuracies. In this post, I’ll discuss these common problems and introduce a Grafana dashboard solution to help you identify and resolve them effectively.
Common Issues with Icinga Director
- Duplicate Addresses: When multiple hosts are assigned the same address, it can result in monitoring conflicts, inaccurate status reports or issues importing objects from an external resource.
- Spaces in Host names: Spaces in host names or display names can lead to various issues, including problems with script automation and inconsistencies in monitoring data. Ensuring that these fields are correctly formatted is a key part of maintaining a clean and efficient monitoring setup.
Proposed Solution: Grafana Dashboard
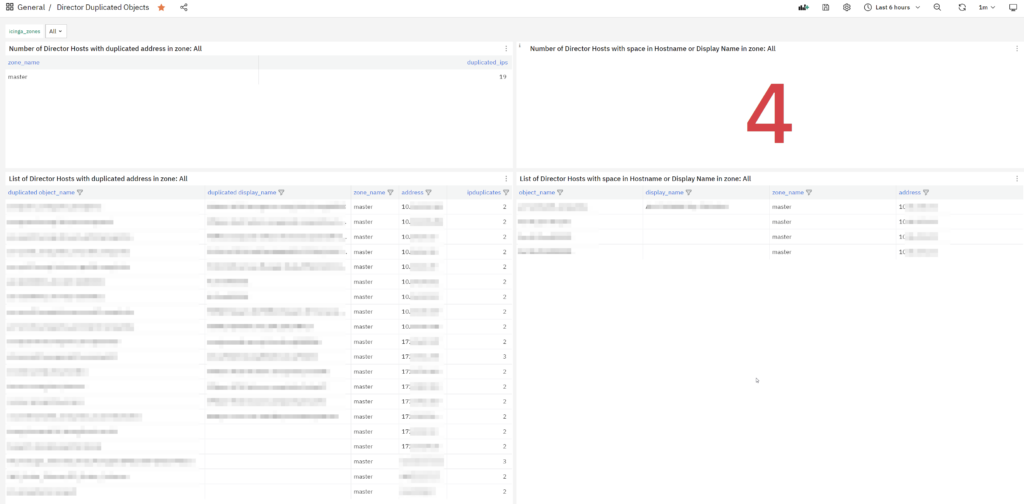
To tackle these issues, I built for a customer a Grafana dashboard that provides clear insights and easy-to-follow lists to help you clean up your Icinga Director configuration. The dashboard includes:
- Number of Director Hosts with Duplicated Addresses
- Number of Director Hosts with Spaces in Host Name or Display Name
- List of Director Hosts with Duplicated Addresses
- List of Director Hosts with Spaces in Host Name or Display Name
Each of these controls can be filtered by icinga_zones, or you can view data for all zones by selecting “All”. This flexibility ensures that you can focus on specific areas of your network/site/client, or get a complete overview as needed.
Prerequisites
To allow Grafana to read from the Icinga Director database, you’ll need to set up the necessary grants for the grafanareadonly user. Use the following script to manage the grants:
#!/bin/bash

# Read the password for the grafanareadonly user from the file
PASSWORD=$(cat /root/.pwd_grafanareadonly)

# Define the database and user variables
DATABASE="director"
USER="grafanareadonly"

# Define the hosts for granting privileges
HOSTS=("localhost" "%.neteyelocal")

# Grant SELECT privileges to the user on each host and flush privileges
for HOST in "${HOSTS[@]}"; do
    MYSQL_CMD="GRANT SELECT ON \`${DATABASE}\`.* TO '${USER}'@'${HOST}' IDENTIFIED BY '${PASSWORD}'; FLUSH PRIVILEGES;"
    mysql -e "${MYSQL_CMD}"
done

# Function to check if the grants were successfully applied
check_grants() {
    HOST=$1
    EXPECTED_GRANT="GRANT SELECT ON \`${DATABASE}\`.* TO \`${USER}\`@\`${HOST}\`"
    ACTUAL_GRANT=$(mysql -e "SHOW GRANTS FOR '${USER}'@'${HOST}';" | egrep "${EXPECTED_GRANT}")

    if [[ -n "${ACTUAL_GRANT}" ]]; then
        echo "[OK] - Grant for '${USER}'@'${HOST}' is correctly set."
    else
        echo "[CRITICAL] - Grant for '${USER}'@'${HOST}' is missing or incorrect."
    fi
}

# Check the grants for both hosts
for HOST in "${HOSTS[@]}"; do
    check_grants "${HOST}"
done
Dashboard Download
You can export this dashboard from our NetEye Demo. If you can’t remember how to export and import a dashboard into your NetEye, you can follow the instructions I included in this blog post.
Conclusion
Managing Icinga Director configurations can be challenging, but with the right tools and processes, you can ensure data consistency and reliability. The Grafana dashboard solution provides an easy-to-use interface for identifying and resolving common issues like duplicate addresses and spaces in host names. With the ability to filter data by zones, you have the flexibility to focus on specific areas of your network or get a holistic view. Try it out and see how it can simplify your Icinga Director management.
Happy monitoring!
These Solutions are Engineered by Humans
Did you find this article interesting? Does it match your skill set? Our customers often present us with problems that need customized solutions. In fact, we’re currently hiring for roles just like this and others here at Würth Phoenix.


Giuseppe Di Garbo
Consultant at Würth IT Italy
Hi everybody. I’m Giuseppe and I was born in Milan in 1979. Since the early years of university, I was attracted by the Open Source world and operating system GNU\Linux. After graduation I had the opportunity to participate in a project of a startup for the realization of an Internet Service Provider. Before joining Würth Phoenix (now Würth IT Italy) as SI consultant, I gained great experience as an IT consultant on projects related to business continuity and implementation of open source software compliant to ITIL processes of incident, change and service catalog management. My free time is completely dedicated to my wife and, as soon as possible, run away from Milan and his caotic time and trekking discover our beautiful mountain near Lecco for relax and lookup the (clean) sky.
Author
Latest posts by Giuseppe Di Garbo
19. 12. 2025
Atlassian, Service Management
Jira Service Management Customer Detail Fields: A Practical Use Case
29. 09. 2025
Atlassian, Service Management
Streamlining Service Request Management with ITIL4 and Jira Service Management
30. 06. 2025
Atlassian, Service Management
Creating Jira Service Management Requests from a Public Website? Here’s the Secure, No-API Way
28. 03. 2025
Atlassian, Service Management
Effortless On-Call Management with Jira Service Management