


24. 12. 2025
APM, Log-SIEM, Machine Learning, NetEye, Real User Experience

Release of Alyvix 2.3 Carnera
New features to automate and measure application transactions
[if you are not familiar with Alyvix, please have a look at the info-box at the bottom of this article]
The new Alyvix master release 2.3 comes up with some major enhancements such as controllable precision and accuracy, more detailed reports and new performance storing and publishing capabilities. In the following article, you will find important information regarding these new features.
Higher robustness and flexibility of graphic detection
Robust and flexible detection of objects by defining multiple components, tolerance thresholds and so-called regions of interest
User transactions are synthesized in Alyvix keywords, where each keyword defines a graphic element and the way in which Alyvix has to interact with it.
From Alyvix 2.3 it is possible to select one main component and an unlimited number of sub-components. Moreover, a region of interest (ROI), where the element can potentially appear, can be defined for every component.
Therefore it does not matter if an application is rendered in slightly different manners (e.g. because of a different Internet browser).
Today it is also possible to detect if graphics disappear from the screen.
Adjustable precision and accuracy of performance measurements
The working frequencies of the Frame Grabber and the graphic detector can be changed to control the precision and accuracy of the performance measurements
Alyvix is now able to measure the performance of transactions with adjustable levels of precision and accuracy. In case of a regular (virtual) machine it is possible to achieve a precision of 1 tenth of second (frame grabber period) and an accuracy of 2 tenth of seconds (graphic detector period). With powerful machines both measurement statistics can have a magnitude in the order of tens of milliseconds. These working frequencies can be also set during ongoing test cases and just for a single crucial transaction. At the cost of higher CPU consumption, it is possible to sharpen the correctness of a measure if necessary.
Test cases script a series of Alyvix keywords, each of them outputs its performance, which is the needed amount of milliseconds to visually detect the defined graphic elements, starting from the termination of the previous keyword. The processing time related to the phase of detection, interaction and output is kept out of performance results, leaving the measurements purely net of the real transaction time.
Keywords can be reused for other test cases. The several performances, measured at each step, are separately retained and can also be aggregated, thanks to new Perfdata keywords in Alyvix API.
HTML reports of test cases
The Reporting system provides visual state certifications and failure animations
Alyvix 2.3 generates HTML pages to report performance data and application screenshots to certify that a certain visual appearance was reached. In case a test case fails, a red traffic light is shown at the point of failure, together with an animation (.gif) that highlights the reasons why a certain interface element was not found.
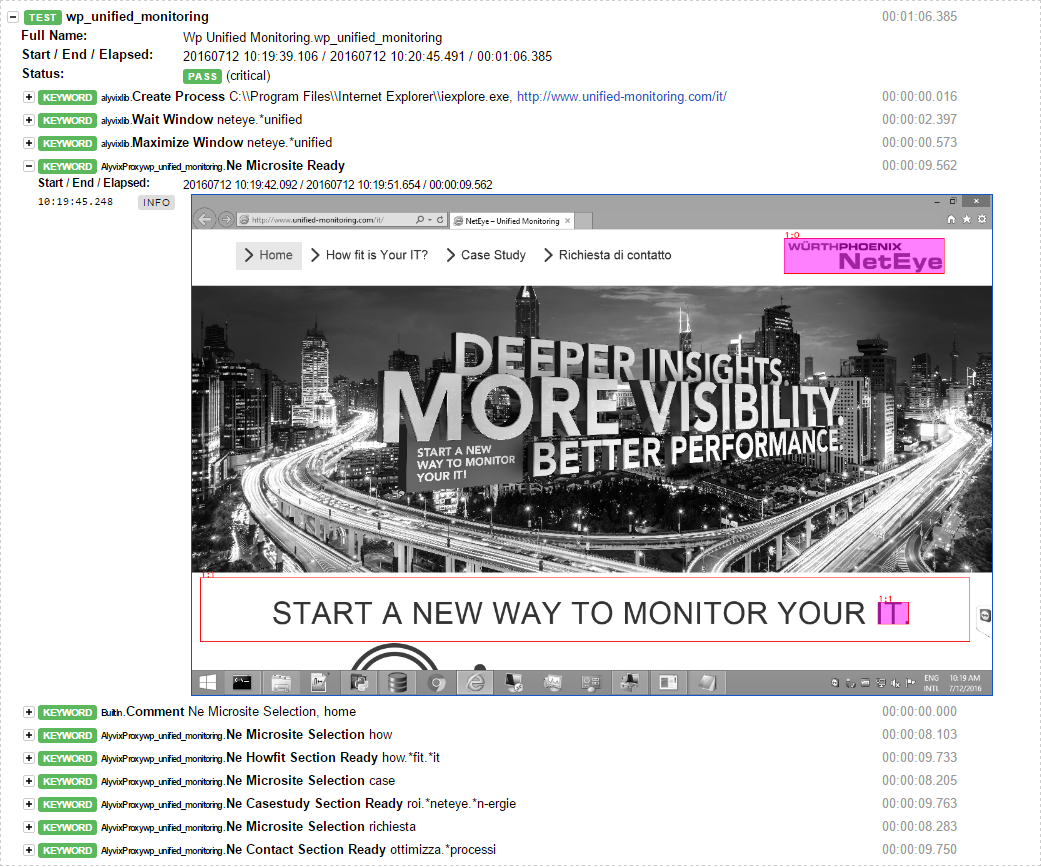
That represents a certification of the quality of service of the application. During the building phase of a test case, reports are the primary troubleshooting tool.
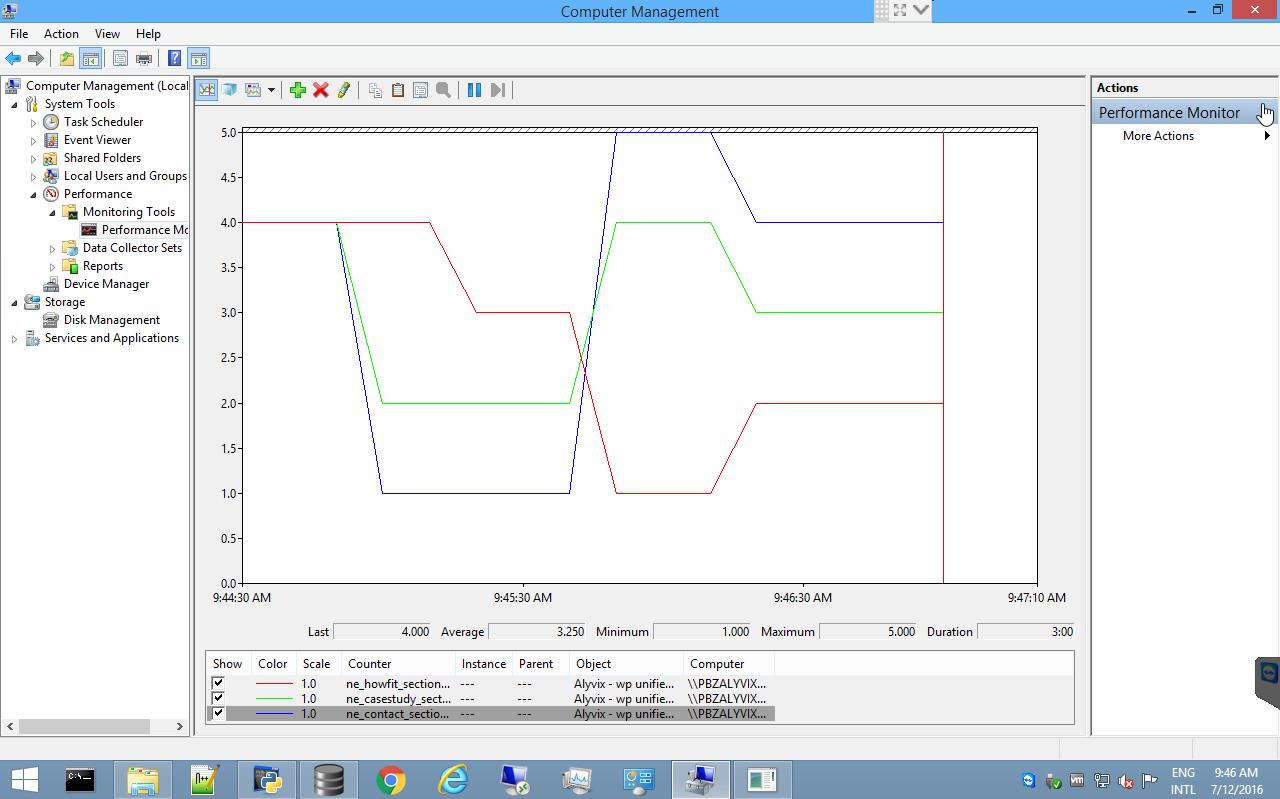
Performance data retention and publication
Alyvix database stores performances and its Windows service publishes them
Alyvix 2.3 can retain all the collected performance data within its own database. Moreover, that data can be publish thanks to the Windows Alyvix service (deployed out-of-the-box) in the Windows Performance Monitor. This enables any monitoring system to pull Alyvix measurements simplifying the integration of test case performances.
Alyvix Info-Box
[box]
Monitoring any application, also if you have no access to the server!
User-unfriendly application latencies are mainly due to software quality, machine hardware and telecommunication channels. Therefore, a synthetic monitoring system is the first step to control a provided service from the end users’ point of view.
You can define so-called test cases, which Alyvix then executes. A test case is a set of operations, which have to be completed on your target application. Alyvix executes the test cases and measures the performance of each single transaction.
Alyvix browses a GUI, exactly as a human user would do and interacts with the detected objects. The engine is able to detect and interact with a series of graphical objects (e.g. icons, buttons, text etc.).
The purpose of test cases is to check the availability of IT-services and to measure their responsiveness. As output, Alyvix generates HTML reports, which contain performance data and screenshots of each transaction and. Moreover, for failed test cases, Alyvix reports an animation (.gif), which shows the issue that was the reason of failure.
The integration of Alyvix to existing monitoring systems allows scheduling multiple tests and to collect and store all their outputs. As a result, it is possible to plot past and ongoing performance data and to set notifications when transaction times pass warning or critical thresholds or when tests break. Infographics are straightforward ways to catch service latencies and downtimes of business-critical applications. Alyvix supports an active monitoring approach, which takes into account the user perception. In contrast to that, the passive monitoring approach probes the network traffic on physical channels. To do this, other solutions as NetEye Real User Experience have been developed.
See also www.alyvix.com
[/box]
NetEye Blog Admin
Author
Latest posts by NetEye Blog Admin
25. 03. 2020
Events
Dear customers and partners,