
26. 09. 2017
Patrick Zambelli
Capacity Management, Nagios, Nagios Plugins, NetEye
Monitorare il traffico di rete su Hyper-V non è più un problema
Il monitoraggio del traffico di rete sui dispositivi di rete si basa tradizionalmente sulle query SNMP. Attraverso comandi predefiniti questo protocollo riesce a generare le statistiche per la trasmissione di pacchetti di dati da una o più interfacce di rete.
Mentre le query sui dispositivi di rete vengono ancora eseguite tramite SNMP, nell’area dei server Microsoft Hyper-V è necessario l’adozione di altri approcci per generare tali statistiche. Uno dei motivi consiste nella configurazione della connessione di rete: ad esempio, molte interfacce di rete fisiche di un apparecchio Hyper-V appartengono ad un’interfaccia logica, che può anche distribuire il traffico di rete su più dispositivi di rete, ad esempio su diversi switch. Un’altra ragione per l’utilizzo di approcci alternativi è che Microsoft ha terminato la manutenzione e l’innovazione dei servizi SNMP sui loro sistemi operativi.
Schematicamente, un cablaggio di rete fisica potrebbe essere il seguente: Un host fisico Hyper-V dispone di due connessioni di rete fisiche attive che sono collegate alla rete tramite due switch.
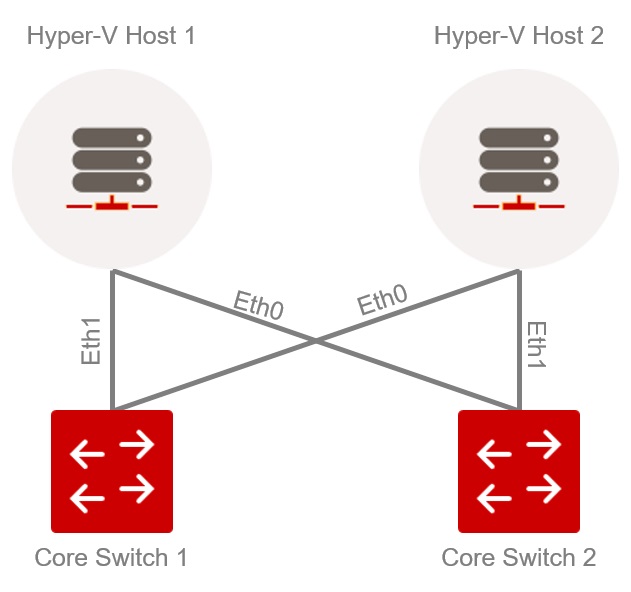
Esempio di cablaggio di una rete fisica
Questa architettura viene ampliata da un livello logico (all’interno dell’infrastruttura Microsoft Hyper-V) ad un ulteriore livello: la scheda di rete virtuale Hyper-V. Questo forma l’interfaccia per l’infrastruttura Hyper-V per trasferire i pacchetti dati alla rete. Un esempio di questa infrastruttura potrebbe essere simile a questo esempio
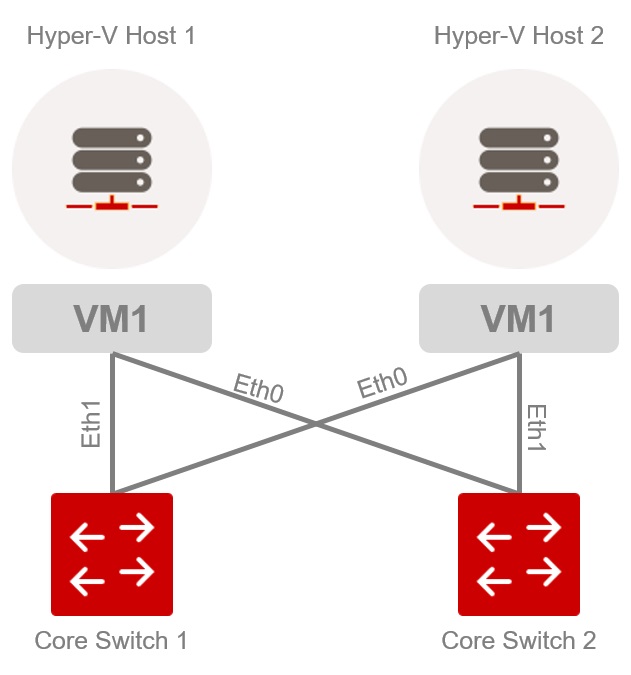
Esempio di cablaggio di rete con interfaccia per l’infrastruttura Hyper-V
Qui si può vedere che non è possibile calcolare statistiche complessive di trasferimento, né sullo switch nè sul server stesso, considerando le interfacce fisiche. Esempio: se si aggrega tutto il traffico in entrata che arriva a “CoreSwitch 1”, si ottiene una panoramica dell’intera infrastruttura Hyper-V, ma non è possibile determinare il traffico generato da un singolo host Hyper-V, dato che il traffico è distribuito su più switch. È per questo motivo che è necessario misurare il traffico di rete, considerando l’interfaccia logica, nell’esempio ‘VM1’.
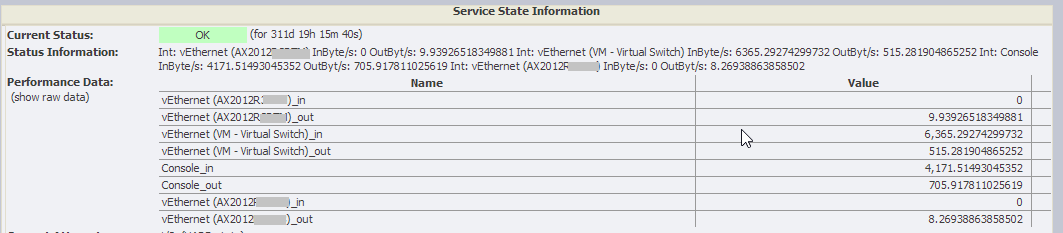
Per raggiungere questo obiettivo, è stato scelto un approccio basato sui comandi PowerShell, che chiama uno script su Hyper-V tramite NSClient ++. Questo script è basato sul comando “Get-NetAdapter” e fornisce le statistiche di trasferimento di tutte le interfacce di rete logiche tramite “Get-NetAdapterStatistics”. Queste statistiche consistono in un conteggio in byte e devono essere calcolate in un passaggio successivo in base agli intervalli trascorsi dall’ultima chiamata.
Il risultato del calcolo viene formattato in formato standard Nagios per la visualizzazione in NetEye.
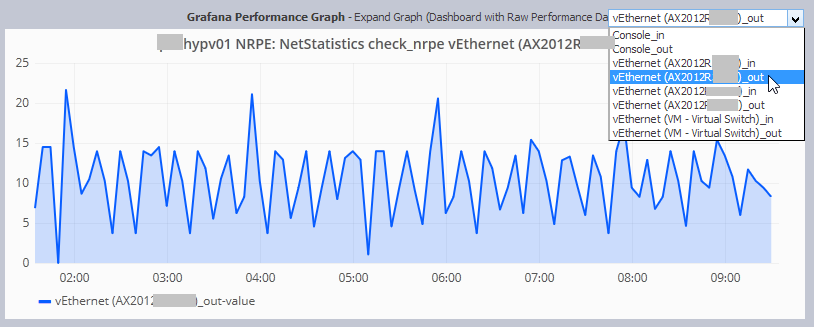
La rappresentazione grafica viene eseguita nel grafico PNP4Nagios e nella versione più recente di NetEye anche in Grafana in base ai dati raccolti in InfluxDB.
Se desiderate avere lo script PowerShell e una breve guida per la sua configurazione di NSClient ++ (versione 0.4.x) potete scaricare il seguente file zip: netAdapterStatistics


Patrick Zambelli
Project Manager at Würth IT Italy
After my graduation in Applied Computer Science at the Free University of Bolzano I decided to start my professional career outside the province. With a bit of good timing and good luck I went into the booming IT-Dept. of Geox in the shoe district of Montebelluna, where I realized how a big IT infrastructure has to grow and adapt to quickly changing requirements. During this experience I had also the nice possibility to travel the world, while setting up the various production and retail areas of this company. Arrived at Würth Phoenix (now Würth IT Italy) I started developing on our monitoring solution NetEye. Today, in my position as Consulting an Project Manager I am continuously heading to implement our solutions to meet the expectation of your enterprise customers.
Author
Latest posts by Patrick Zambelli
16. 01. 2024
NetEye, Unified Monitoring
Icinga 2 DSL for Defining the Monitoring Status of Objects with Director
23. 12. 2020
NetEye
Tornado – Getting in Action with Sample Rules
05. 05. 2020
NetEye, Unified Monitoring
Import Data Correlation and Automation with Icinga2 Director