18. 03. 2025
Icinga Web 2, ITOA, NetEye, UI, Unified Monitoring


Grafana is an open source dashboard tool that helps users to easily create and edit dashboards. Grafana uses Golang as a backend and Angular as frontend. It is quite a large codebase and supports a large number of options for its components (data sources, options, panels, etc.). Grafana’s stylesheet is written using the Sass CSS extension language. This preprocessor can help customizing themes.
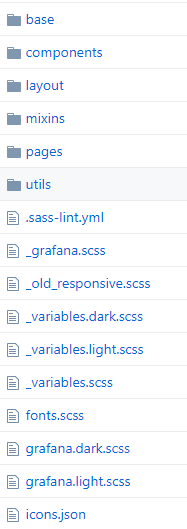
All Sass files are located in the public/sass folder.
The base folder, contains some generic files like font, icons, etc. In the component folder you can find stylesheets for all the HTML components such as buttons, navbars, searchbars, tabs and more. All the rules that manage page structure and layout parameters can be found in the layout directory. The mixins directory is self-explanatory: it contains all patterns of property-value pairs, which other rulesets can then reuse. In the pages directory you can find page-dedicated files, for example styles for the dashboard, for the error page, the login page and so on. The utils directory contains declarations such as spacing, width, etc.
As you can see from the screenshot of the main Sass folder, there are also generic files that manage themes and the sass compiler.
If you need to change some style characteristics on your Grafana interface, you just need to customize one of the sass files and then recompile the theme.
Interface customization is a rather easy operation. Let’s suppose we want to use a corporate color theme in our Grafana dashboard. The steps are:
0 – Install Grafana
If you haven’t done it yet, I suggest that you install Grafana on your machine by following the guide here: Building Grafana from source. In this way you will automatically install Node.js and the sass compiler Yarn.
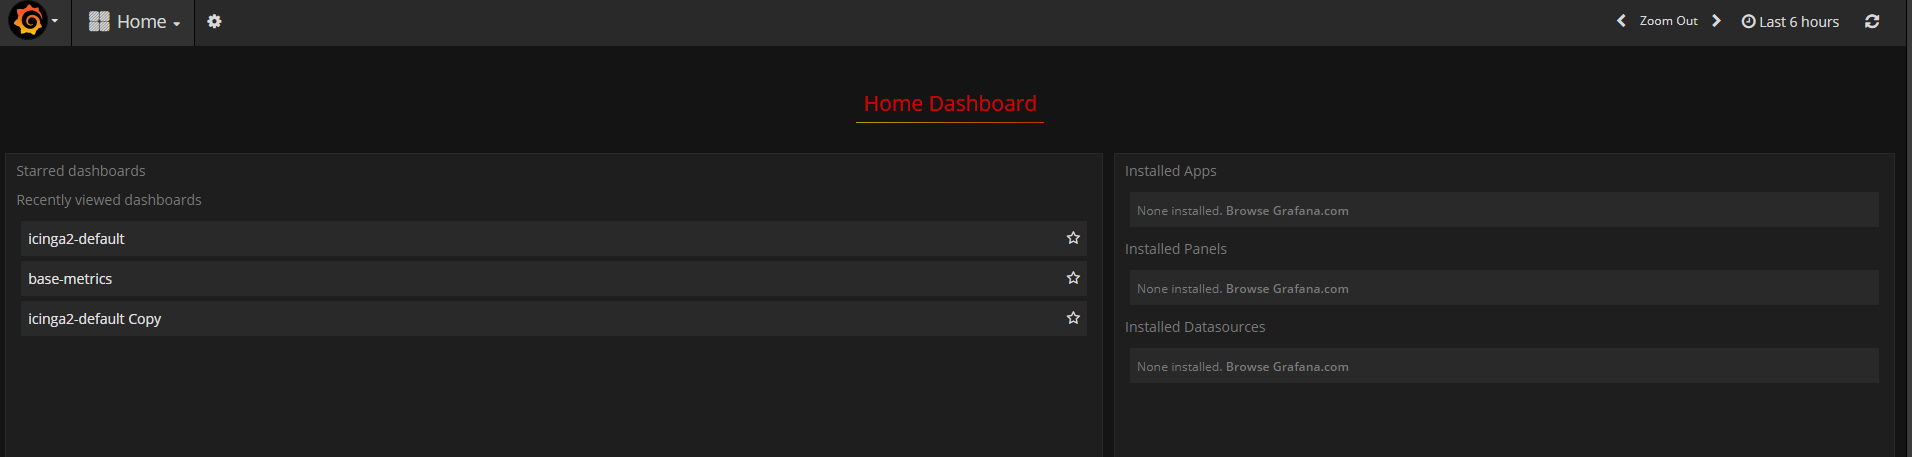
1 – Start from the existing theme you like the most
If you want to change the default Grafana colors to red and black, it is both simplest and fastest to change the colors inside the _variables.dark.scss file. Changing the values for the color variables in this file means they will be changed throughout the interface when using the dark theme.
For example, we can change the background color from:
$dark-2: #1f1d1d;
to
$dark-2: #1e1e1e;
And add a new red color for titles:
$custom-red: #cc0000;
2 – Change the style
If you want to change more than just colors, you can customize other .sass files. For instance, if I want to change the color of the dashboard title, I can change the settings in the _dashboard.sass file:
.dashboard-header {
color: $custom-red;
font-family: $headings-font-family;
font-size: $font-size-h3;
text-align: center;
span {
display: inline-block;
@include brand-bottom-border();
padding: 0.5rem .5rem .2rem .5rem;
}
}
3 – Compile the Grafana frontend
Once you’ve finished your style customization, you just need to launch the frontend build process using the following command:
npm run build
An updated Grafana theme will then be generated inside the public_gen/css/ folder, and after refreshing the page in the browser, you’re done!

Valentina Da Rold
Hi, I'm Valentina and I'm a Frontend Developer at Wuerth IT Italy. I started out my career applying my Cryptography skills to coding, but really quickly fell in love with the web. I have been making websites and applications since 2012 and I still can't get enough of it. Along the way I found a passion for front-end development, and I use this passion to create interfaces that solve problems. When I'm not creating beautiful solutions, I enjoy cooking or doing sport, while listening to beautiful music.
Author
Latest posts by Valentina Da Rold
30. 06. 2026
Atlassian, Development
Build a Readable List of Confluence Spaces with the REST API and an Auto-Generated Page
30. 03. 2026
Atlassian, Automation
Automating Confluence Page Status at Scale: A Practical Workaround
11. 12. 2025
Atlassian, Development
Boosting Atlassian Integrations with the atlassian-python-api Library
29. 09. 2025
Atlassian, Development
Syncing Entra ID Groups and Members to Jira CMDB via Atlassian SCIM API: Key Lessons Learned
04. 06. 2025
Atlassian, Automation, Development
Automating Asset Delivery Tracking in the Jira Customer Portal: A Developer’s Guide