15. 06. 2026
NetEye, Unified Monitoring

07. 08. 2023
Alessandro Romboli
Business Service Monitoring, ITOA, NetEye
From Icinga 2 Monitoring to ITOA
Scenario
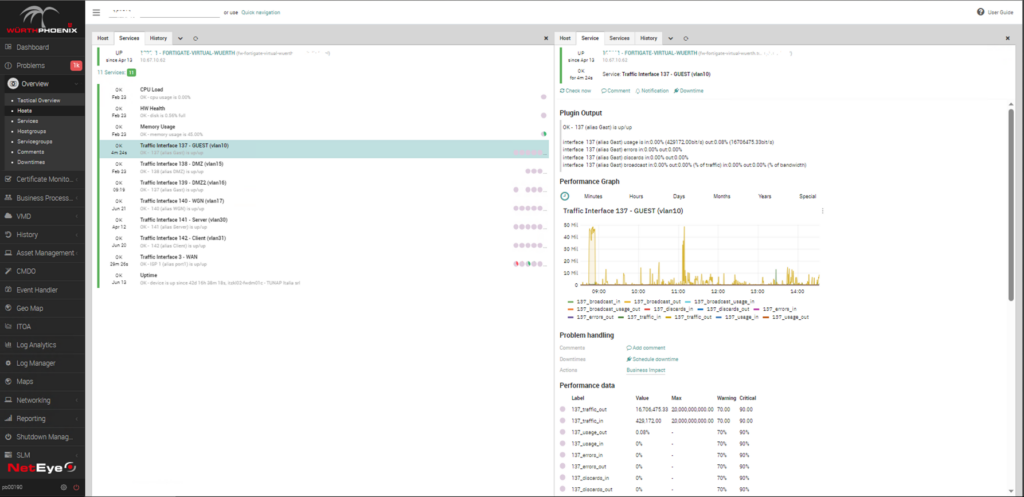
NetEye 4 is a comprehensive monitoring platform which natively supports Icinga 2 checks on remote hosts and devices.
Several Icinga 2 checks support an historical view of the status. An example is the firewall interface performance status below, which displays a Performance Graph:
Getting a better overview
All the graph data generated by the Icinga 2 checks are hosted by default in a local Influx database named “icinga2”. This is very useful for rendering the collected metrics using the Grafana engine in NetEye’s ITOA.
Steps required
First of all, a new Datasource must be defined in ITOA. The Datasource could be of type INFLUX/QL or Flux and requires a read-only account to access the “icinga2” Influx DB:
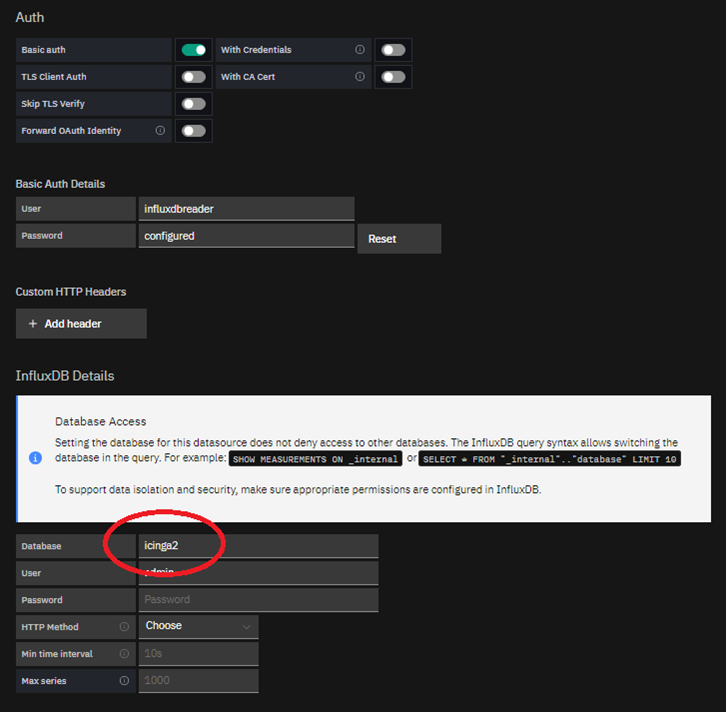
This new Datasource can then be used to create Grafana dashboards.
Where to get data
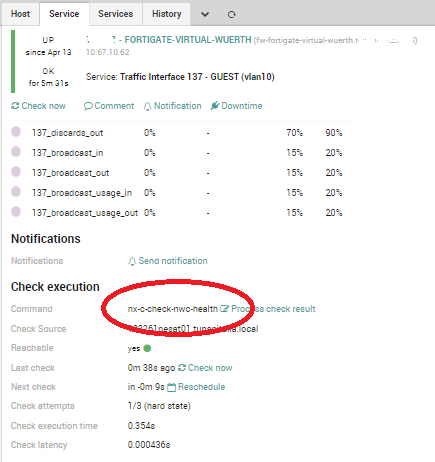
The next question is: how is the collected data named in the “icinga2” database?
The answer is that metrics use the Icinga 2 command name. In the firewall example above, the Icinga 2 command is called “nx-c-check-nwc-health”:
We recommend that the Grafana variable holds the host to be rendered, as in this example:
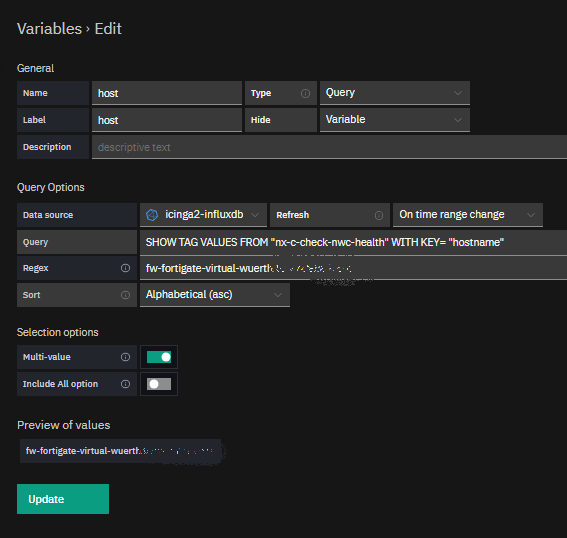
This way, the dashboard can be reused for different hosts just by changing the Regex field in the variable definition. Thus an Influx-QL query sample to get the firewall graphs of all the firewall interfaces, which uses the host variable defined above, becomes:
SELECT max("value") FROM "nx-c-check-nwc-health" WHERE ("hostname" =~ /^$host$/) AND ("service" =~ /Traffic Interface/) AND $timeFilter GROUP BY time($__interval), "service" fill(null)
When this query is rendered as a Grafana panel it produces this dashboard:
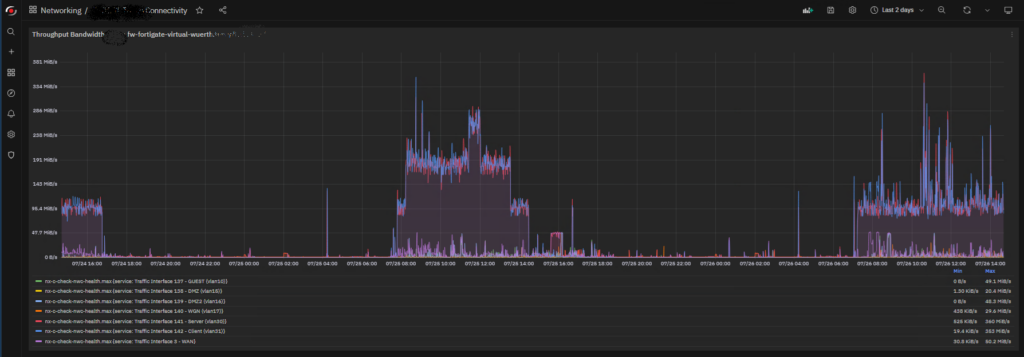
In a single dashboard you can see the traffic of all the firewall interfaces with the max value in the selected time period.
A further example
Icinga 2 graphs are useful not just for network performance, but also for host monitoring. The example below is an ITOA dashboard which monitors vSphere infrastructure performance and also shows the VMware datastore allocation over the time period.
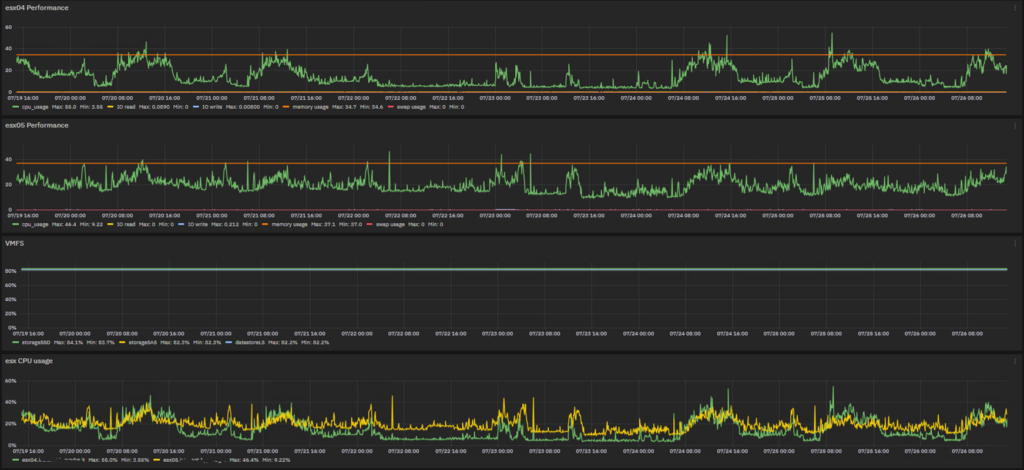
Icinga 2 monitoring is very powerful: with ITOA and the Grafana engine, you can make dashboards even more useful!
These Solutions are Engineered by Humans
Are you passionate about performance metrics or other modern IT challenges? Do you have the experience to drive solutions like the one above? Our customers often present us with problems that need customized solutions. In fact, we’re currently hiring for roles just like this as well as other roles here at Würth Phoenix.

Alessandro Romboli
Site Reliability Engineer at Würth IT Italy
My name is Alessandro and I joined Würth Phoenix (now Würth IT Italy) early in 2013. I have over 20 years of experience in the IT sector: For a long time I've worked for a big Italian bank in a very complex environment, managing the software provisioning for all the branch offices. Then I've worked as a system administrator for an international IT provider supporting several big companies in their infrastructures, providing high availability solutions and disaster recovery implementations. I've joined the VMware virtual infrastructure in early stage, since version 2: it was one of the first productive Server Farms in Italy. I always like to study and compare different technologies: I work with Linux, MAC OSX, Windows and VMWare. Since I joined Würth Phoenix, I could also expand my experience on Firewalls, Storage Area Networks, Local Area Networks, designing and implementing complete solutions for our customers. Primarily, I'm a system administrator and solution designer, certified as VMware VCP6 DCV, Microsoft MCP for Windows Server, Hyper-V and System Center Virtual Machine Manager, SQL Server, SharePoint. Besides computers, I also like photography, sport and trekking in the mountains.
Author
Latest posts by Alessandro Romboli
17. 06. 2026
Microsoft
UEFI secure boot nightmare
03. 12. 2025
Microsoft
Single Sign-On for Power BI Report Server
08. 09. 2025
Service Management
VMware ESXi Transparent Page Sharing
12. 06. 2025
Microsoft
Terminal Server User Profiles with FSLogix