


14. 12. 2023
Service Management

A service desk system such as EriZone leads users to pursue recommended processes and is thus able to gather a large amount of structured data.
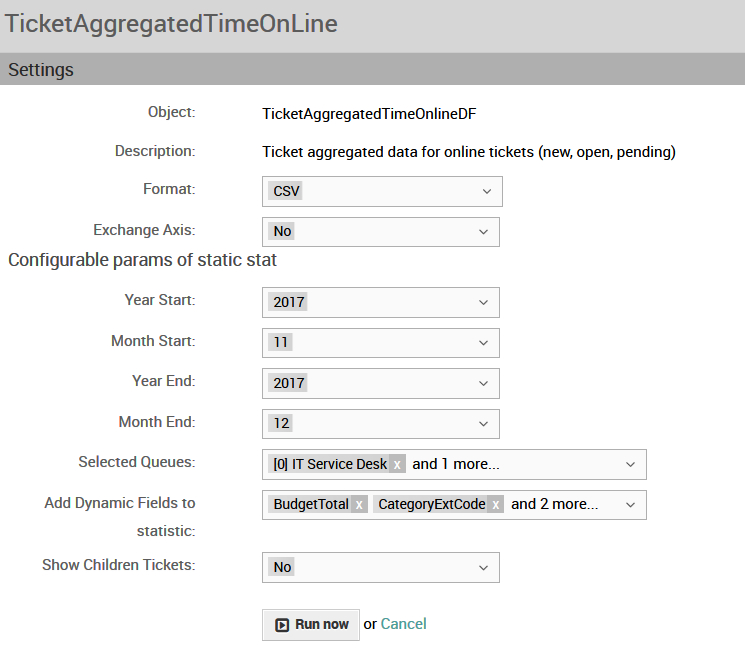
In addition to EriZone’s standard dynamic statistics, which can be assembled and configured by the agents themselves on the web interface by combining the data sets provided by the API, two data warehouse tables are available in EriZone. These data tables, called “TicketAggregatedTime” and “TicketAggregatedTimeOnline” (for closed and open tickets, respectively) not only gather most of the data available on tickets into a single table, but also add various calculated metrics, such as elapsed time without “pending” time, aggregated solution times of child tickets, first ownership time, and more.
These two statistics are used to continuously populate dedicated database tables, which can be analyzed via ODBC by business intelligence tools such as MS PowerBI or simply with Excel Pivot tables. Moreover, due to the specific data that can be obtained, these statistics are also popular for manual data extraction to CSV or Excel file. For this reason, in the latest releases we have added the ability to filter tickets by queues and agents according to these statistics. Now when running these statistics in EriZone 5.3 you can also select a set of dynamic fields that should be included for each ticket. This will at last allow you to retrieve important additional information stored during ticket creation and processing (e.g. project numbers, costs, and bug tracking references), without the need for custom implementations.
Of course, each of the selected additional fields is stored as an additional row on the exported file and this should be taken into consideration when importing the resulting file in databases or applications.
Obtaining SLA statistics when using the “Advanced Escalations” feature
The “OTRS Advanced Escalations” feature adds a large number of options that define detailed time intervals for evaluating service level agreements, e.g. by making it possible to use specific start dates, or to suspend, resume or restart SLA timers when a particular change (an event) happens on the ticket. The increased flexibility and complete configurability of SLA escalation counters created with the “Advanced Escalation” feature, however, makes it impossible to use the three standard escalation metrics available in the system (First response time, Update time, Solution time). We thus developed an additional static statistic that provides a concise overview of ticket “Advanced Escalations” times, covering all aspects such as suspension times, working times, and current escalation information. For each ticket, the resulting table includes an entry for each escalation type1 and for each occurrence of such an escalation2. The module “AdvancedEscalationReport” is currently available on request.
1 “Advanced Escalations” lets you define as many timers as you need for an SLA (or OLA) that can be associated with a ticket. Some ideas for measurable time intervals are: first owner time, 2nd level solution times, the time spent waiting for customer action, or the effective working time from authorization to delivery.
2 “Advanced Escalations” timers can be restarted more than once for a single ticket. E.g., for a given ticket it might be necessary to measure the waiting time for requests to an external 3rd level support several times.
Mirko Morandini
Mirko Morandini, PhD, is a senior consultant in IT Service Management and Asset Management, with over a decade of experience and numerous successful projects in Germany, Austria and Italy. As the GLPI advocate at Würth IT Italy, Mirko is passionate about open source solutions - and when he’s not optimizing IT processes, he enjoys spending time with his family and playing and conducting wind band music.
Author
Latest posts by Mirko Morandini
31. 03. 2026
Asset Management, GLPI, Service Management
GROUP-based Asset Permissions in GLPI 11: GLPI Rights Management Redefined
29. 09. 2025
Asset Management, GLPI, Knowledge Management, Service Management
Getting the M(u)st out of GLPI
30. 06. 2025
Asset Management, Unified Monitoring
Das neue GLPI 11 – offizielle deutsche Vorstellung [DE]
31. 03. 2025
Asset Management, GLPI, Knowledge Management, NetEye
GLPI: Automated Inventory Without Using GLPI Agents