
In the past I’ve written in this blog post about Elastic Stack and its features.
Here I’d like to show you more in depth the functionality of Graph analytics.
The Graph analytics features enable you to discover how items in an Elasticsearch index are related. It’s possible to explore the connections between indexed terms and see which connections are the most meaningful. This can be useful in a variety of applications, from fraud detection to recommendation engines. For example, graph exploration could help you uncover website vulnerabilities that hackers are targeting so that you can harden your website. Or, it’s possible to provide graph-based personalized recommendations to your e-commerce customers. You can find the documentation about this functionality here.
Suppose I have some data from a firewall that I want to explore. I load this data in custom index that I call CEF (I chose this name because the information is in this format) and I normalize the date using the Elastic Common Schema (ECS).
The Elastic Common Schema (ECS) is an open source specification developed with support from the Elastic user community. ECS defines a common set of fields to be used when storing event data in Elasticsearch, such as logs and metrics.
ECS specifies field names and Elasticsearch datatypes for each field, and provides descriptions and example usage. ECS also groups fields into ECS levels, which are used to signal how much a field is expected to be present. You can learn more about ECS levels in Guidelines and Best Practices. Finally, ECS also provides a set of naming guidelines for adding your own custom fields.
So first I open NetEye:
And then I open Log Analytics and arrive at Elastic Stack:
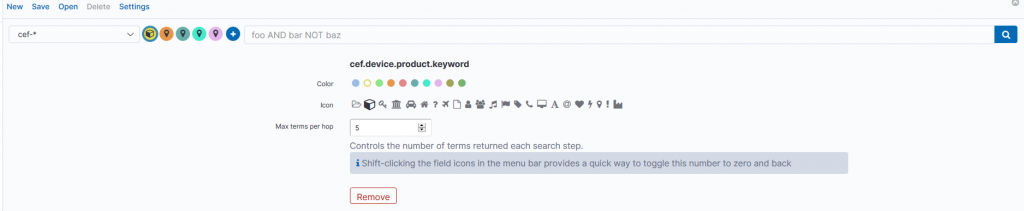
From here I open the Graph module:

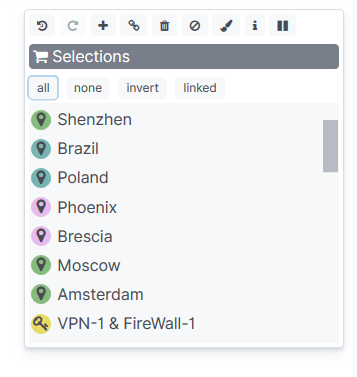
Next I select my index “CEF” and select the field whose connection I’d like to explore in order to see insight or analytics about the security. In my case I choose the source and destination country, the city name, and the product VPN. It’s very simple to use and select fields – I can even choose the icon and color to associate with the component.
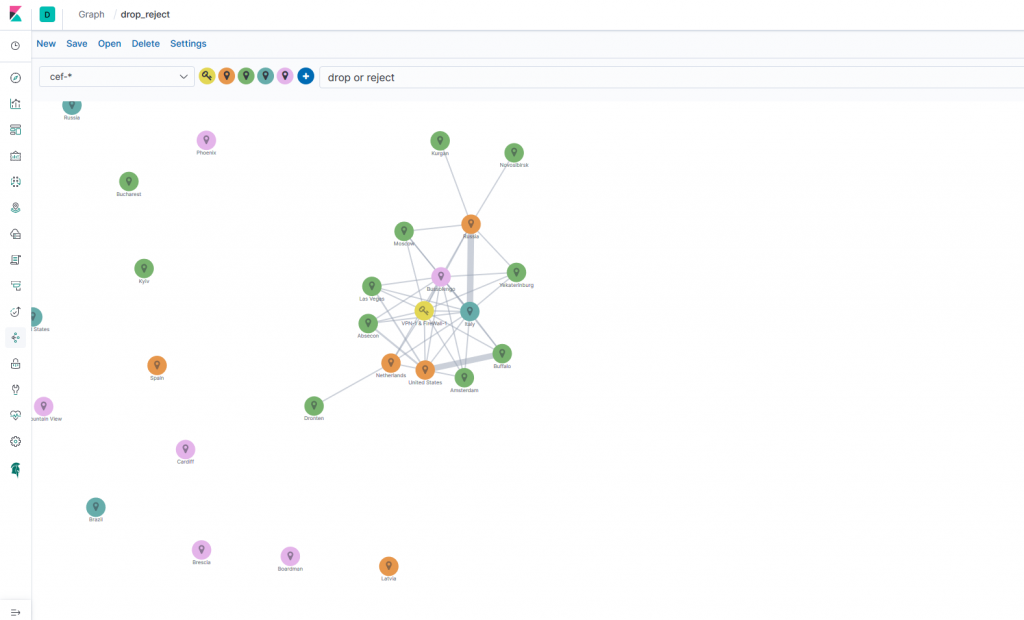
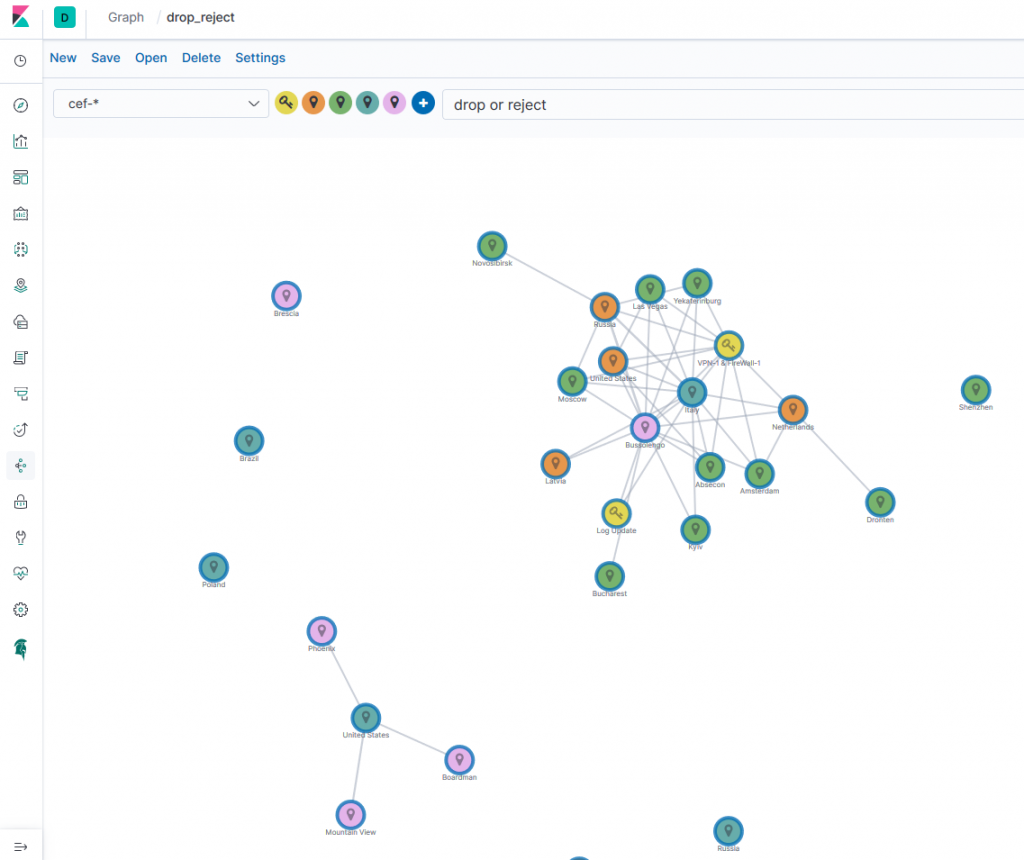
At this point I have to select the term that I want to use to explore the connection. I have data from a firewall, and I’d like to explore the data and the connection in drop, so I use the terms drop and reject. I then obtain this Graph:
With the following menu:
You could use this to:
- Display additional vertices that connect to your graph, by clicking on the expand icon.
- Display additional connections between the displayed vertices, by clicking on the link icon.
- Explore a particular area of the graph, select the vertices you are interested in, and then click expand or link.
- Step back through your changes to the graph, by clicking undo and redo.
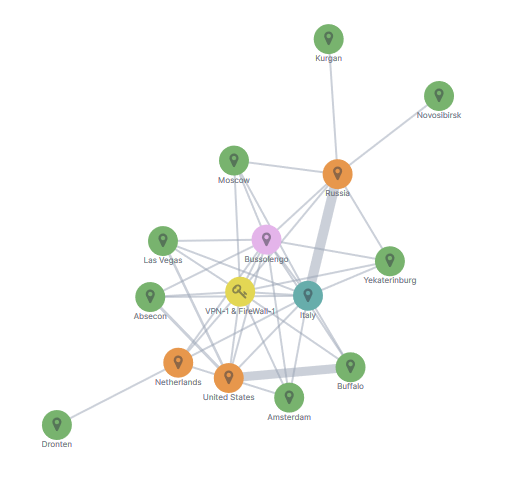
Next I add an additional connection, after which the system selects further possible connections, and I find this resulting Graph in which cities of USA are placed.
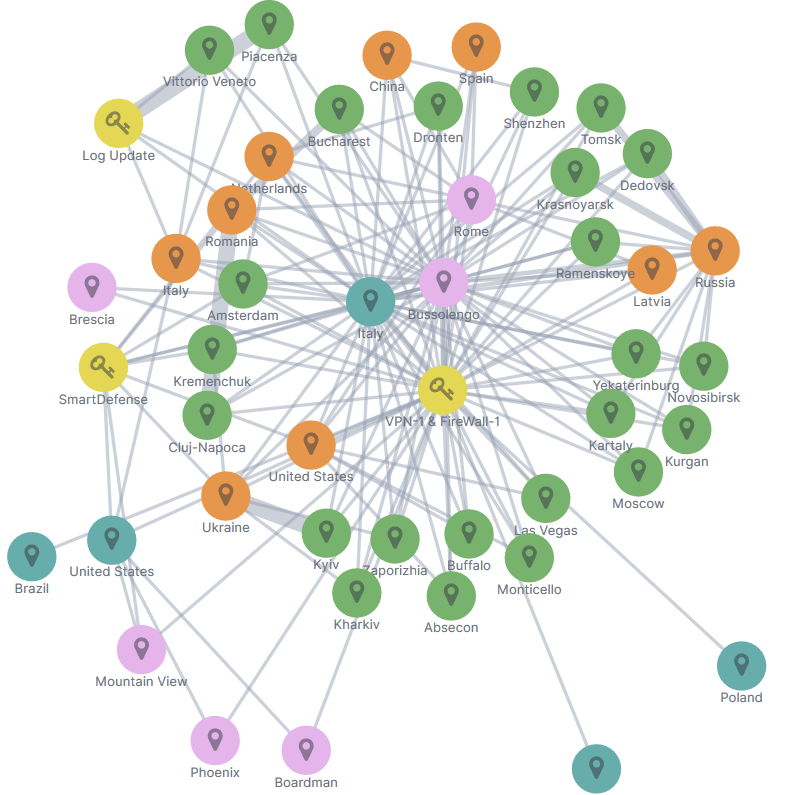
I continue to add new vertices and more connections, and in the end I find a beautiful complex Graph:
So then I come back to the first simple Graph:
In this Graph I find confirmation that the firewall has been blocking many packets from Russia, the Netherlands and the United States, and I can investigate which city has a significant number of drops and rejects.


Franco Federico
Hi, I’m Franco and I was born in Monza. For 20 years I worked for IBM in various roles. I started as a customer service representative (help desk operator), then I was promoted to Windows expert. In 2004 I changed again and was promoted to consultant, business analyst, then Java developer, and finally technical support and system integrator for Enterprise Content Management (FileNet). Several years ago I became fascinated by the Open Source world, the GNU\Linux operating system, and security in general. So for 4 years during my free time I studied security systems and computer networks in order to extend my knowledge. I came across several open source technologies including the Elastic stack (formerly ELK), and started to explore them and other similar ones like Grafana, Greylog, Snort, Grok, etc. I like to script in Python, too. Then I started to work in Würth Phoenix like consultant. Two years ago I moved with my family in Berlin to work for a startup in fintech(Nuri), but the startup went bankrupt due to insolvency. No problem, Berlin offered many other opportunities and I started working for Helios IT Service as an infrastructure monitoring expert with Icinga and Elastic, but after another year I preferred to return to Italy for various reasons that we can go into in person 🙂 In my free time I continue to dedicate myself to my family(especially my daughter) and I like walking, reading, dancing and making pizza for friends and relatives.
Author
Latest posts by Franco Federico
10. 03. 2026
Unified Monitoring
Elastic AutoOps in NetEye: Simplifying Elasticsearch Operations with Real-Time Intelligence
09. 09. 2025
NetEye
Backing up a MariaDB Galera Cluster
12. 06. 2025
NetEye, Unified Monitoring
From Monitoring to SOC
17. 02. 2025
Unified Monitoring
Monitoring Printer Logs