
11. 01. 2021
Enrico Alberti
Log-SIEM, NetEye
Alerting on NetEye SIEM: Watcher & ‘Alerts and Actions’ (Part 1)
The main goal of a monitoring system like NetEye is to alert and notify you when something noteworthy happens in your environment. All the logs coming in to NetEye SIEM can be analyzed, and could raise one or more alerts in the Elastic Stack, such as detection, machine learning anomalies, etc. How can you make your own alerts on NetEye SIEM?
The Watcher and the new Alerts and Actions features (starting with NetEye 4.15) provide us with a quick and simple solution to detecting specific conditions in the logs we ingest, and then take actions on them.
Watcher: Alerts on Beats Agent Fails
The Watcher feature can be used to create actions based on conditions, which are evaluated periodically using queries on your data.
For example, suppose we want to be notified/alerted when an Agent that collect logs from a source(host) then stops working correctly and no longer sends logs to the system.
We know that each Beats Agent sends multiple metrics on its operational performance to our NetEye Cluster. On the Stack Monitoring tab we can view the details of these events.
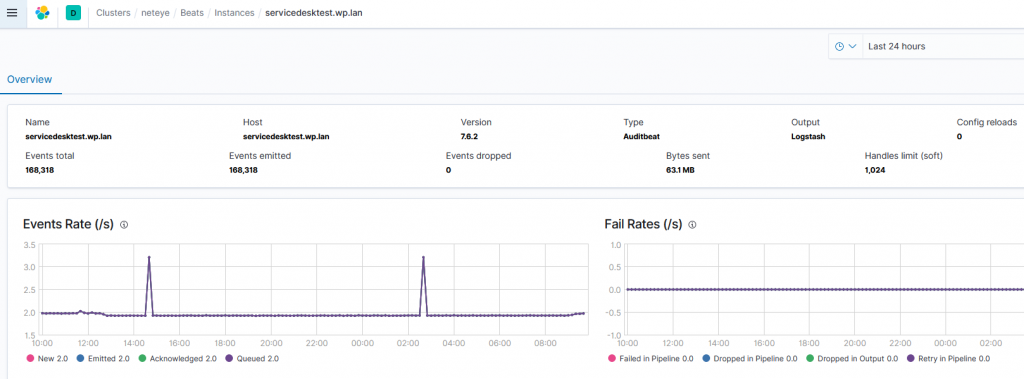
Suppose we’re interested in monitoring the ‘Events total’ metrics that represent the count of all logs/events ingested by the agent and sent to the Elastic database.
The steps to create a Watcher follow this general structure:
- Understand where the information you want is collected in the database
Starting from Stack Monitoring we found that all the information and logs are collected in the system index .monitoring-beats-7-*, and in our case the Event total is the sum of field beats_stats.metrics.libbeat.output.events.total. This field is populated on each log.
- Decide on a trigger interval and potentially a throttle period
Every 30 seconds the agent sends the metrics to Elastic, so the job frequency cannot be lower than that. For our example, let’s choose an interval of 5 minutes. The main purpose of action throttling is to prevent too many executions of the same action for the same watch. In our use case, we don’t set this parameter so that we’ll be alerted each time the condition matches.
- Craft a specific query search to extract the needed logs
Say we want to match when the total events sent in a time period window is equal to 0 (zero).
First, we need to select the time range (window_period) of our query. In our use case, the job analyzes the last 10 minutes of logs. This window should be set to the maximum time value between one log and the next (it usually depends on the source type).
Second, we should group logs using nested aggregation: the beat name and output events. The result is a group of objects, one for each type of Beats Agent, with two fields: the hostname, where the agent is installed, and the total events (document) reached in the time period.
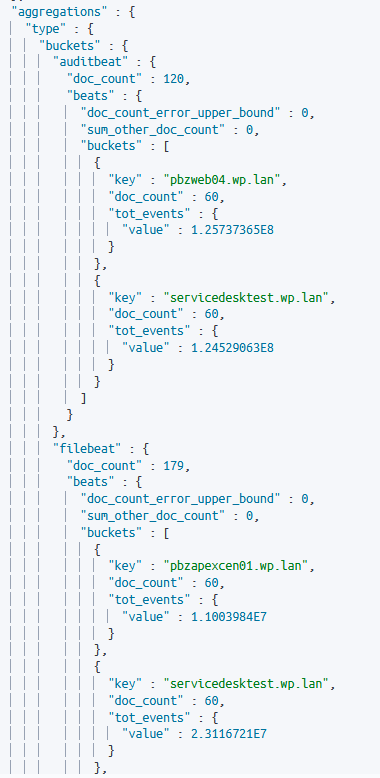
Now we only need to filter to find the buckets with total events equal to 0.
- Write the condition to trigger alerts
The condition that causes alerts to be raised is the presence of one or more items in one of the aggregated Beat Agent buckets.
- Choose the action to perform when the condition matches
To test our watch we can use a simple Log action like the code below:
"log": {
    "foreach": "ctx.payload._value",
    "max_iterations": 500,
    "logging": {
    "level": "info",
    "text": "Beats Agent '{{ctx.payload.type}}' on host '{{ctx.payload.host}}' not send events in the last {{ctx.metadata.window_period}}"
    }
}
In the body of the action we can include all the necessary parameters to help us understand which agent of which host has problems. We also add the foreach field to send an alert for each occurrence of the result query.
Note: To obtain the correct JSON payload, we can manipulate the query’s result by using the transform script following this guide https://www.elastic.co/guide/en/elasticsearch/reference/7.9/transform-script.html
Example result:
    "condition": {
      "type": "script",
      "status": "success",
      "met": true
    },
    "transform": {
      "type": "script",
      "status": "success",
      "payload": {
        "_value": [
          {
            "host": "servicedesktest.wp.lan",
            "type": "filebeat"
          }
        ]
      }
    },
    "actions": [
      {
        "id": "log",
        "type": "logging",
        "status": "success",
        "number_of_actions_executed": 1,
        "foreach": [
          {
            "logging": {
              "logged_text": "Beats Agent 'filebeat' on host 'servicedesktest.wp.lan' not send events in the last 10m"
            }
          }
        ],
        "max_iterations": 500
      }
    ]
Now our Watcher is ready! Whenever an Agent doesn’t send logs for more than 10 minutes an alert will be raised.
Alerts and Actions: The Easy Way
The approach used with Watcher can also be used with the Alerts and Actions feature, but here everything is easier when you use the GUI Wizard.
First let’s create the alert:
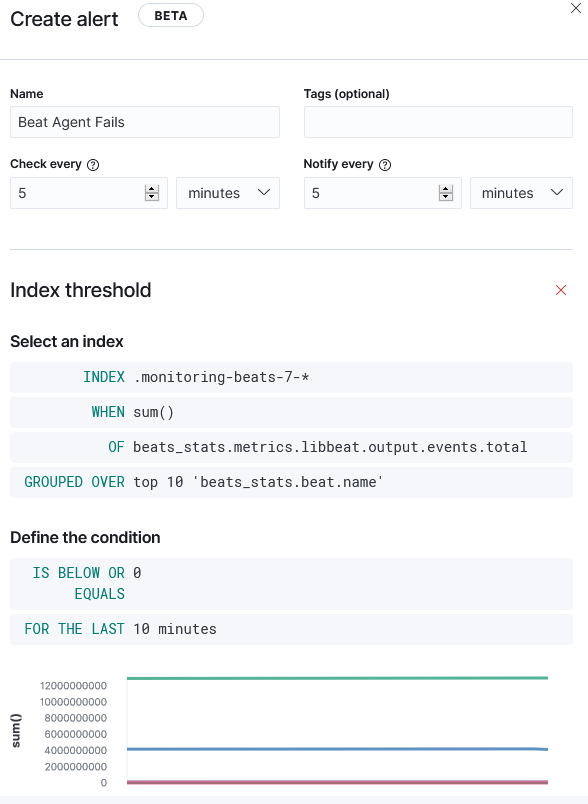
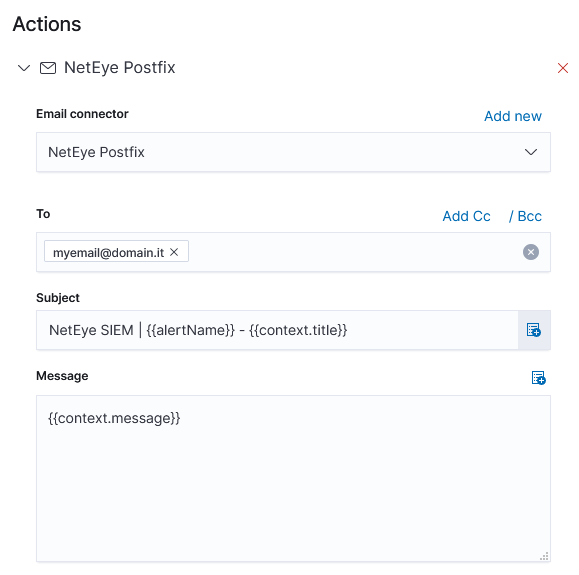
Now choose the action, for instance an email:
Note: With this feature it is NOT possible to generate nested aggregations and transformations as we did in the Watcher example.
Good but not great…
All these features are very nice… but if we’re talking about production environments, what we really need is to raise an alert in NetEye’s Monitoring Overview, and not a simple log or email.
To do this we could use the web-hook action and send it to our Tornado Webhook Collector available on NetEye. Read my next post to find out more…
Useful links:
- https://www.elastic.co/guide/en/elasticsearch/painless/7.9/painless-watcher-transform-context.html
- https://www.elastic.co/guide/en/elasticsearch/reference/7.9/action-foreach.html

Enrico Alberti
I’ve always been fascinated by the IT world, especially by the security environment and its architectures.
The common thread in my working experience is the creation of helpful open-source solutions to easily manage the huge amount of security information.
In the past years, my work was especially focused on Cyber Kill Chain, parsing and ELK Stack but in order to start from the beginning...
In 2010 I left my birthplace, the lovely Veneto, looking for a new ´cyber´ adventure in Milan. After graduating in Computer Systems and Networks Security, I worked for 6 years as a Cyber Security Consultant.
During the first 5 years, I explored the deep and manifold world of cybersecurity, becoming passionate about open source solutions. After that, I decided to challenge myself joining a Start-up company focusing on SOC services (I’m a proud member of the Blue Team!).
In Wuerth IT Italy, I would like to personalize the NetEye System for each one of our customers, in order to develop the perfect product for their needs, by combining all my past experiences and skills.
Author
Latest posts by Enrico Alberti
28. 12. 2023
Log Management, Log-SIEM, NetEye
Monitor Fleet Elastic Agents with NetEye Extension Packs (NEP)
28. 10. 2022
Log Management, Log-SIEM, NetEye
Syslog Collection with Elastic under Distributed NetEye Monitoring
19. 07. 2022
Contribution, NetEye, Unified Monitoring
Integration of Centreon Plugins into NetEye Extension Packs