30. 06. 2026
APM, DevOps, Kubernetes


We have several customers using IBM AS400 whom we’ve helped in the past collect logs of system administrators under NetEye 3. Now with NetEye 4 we’ve improved log collection, making it compliant with the ECS standard and configuring a special internal port (5514) for NetEye to process these logs and syslog logs in general.
Let’s quickly review the concepts behind ECS: the Elastic Common Schema (ECS) is an open source specification developed with support from the Elastic user community. ECS defines a common set of fields to be used when storing event data, such as logs and metrics, in Elasticsearch.
ECS specifies both field names and Elasticsearch data types for each field, and provides descriptions and usage examples. ECS also groups fields into ECS levels, which are used to signal how often a field is expected to be present (you can learn more about ECS levels in Guidelines and Best Practices). Finally, ECS also provides a set of naming guidelines for adding custom fields.
The goal of ECS is to enable and encourage users of Elasticsearch to normalize (properly map) their event data, so that they can better analyze, visualize, and correlate the data represented in their events. ECS was designed to accommodate a wide variety of events. For several years now we’ve had a plug-in installable on AS400 machines that allows us to collect logs relating to administrators’ actions on those machines, and then send them to a syslog server, which in our case is a NetEye 4 machine. We decided to forward the logs from port 514 to port 5514 by modifying the service rsyslog-logmanager.service, using this implementation in the file 01_logstash.conf:
[root@neteye1 conf]# cat /neteye/shared/rsyslog/conf/rsyslog.d/01_logstash.conf
if $fromhost-ip == [ 'IP SOURCE', 'IP SOURCE' ] then {
 action(
  type="omfwd"
  Target="IP NETEYE"
  Port="5514"
  Protocol="udp"
)
 stop
}
Note that this file must be modified to use the actual IP addresses.
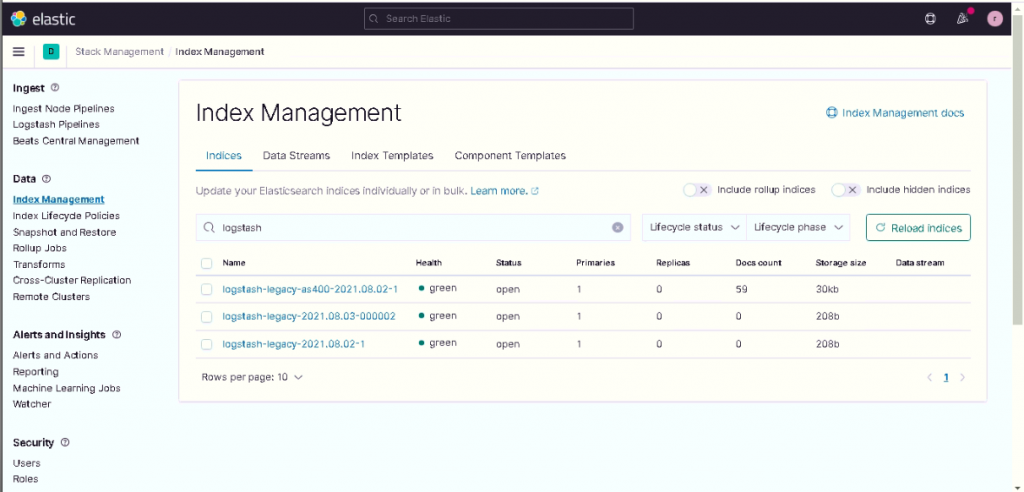
After restarting rsyslog-logmanager.service we decided to prepare an index template called logstash-legacy with the mapping from the most recent version of the logstash index. We then created (as per best practice) an index template called logstash-legacy-AS400 without a mapping.
After creating the template indexes we then create the first indexes which, thanks to the ILM, will rotate every day and will be kept for the number of days specified in the lifecycle policy.
Once that’s done, we customize the syslog.yml file as shown here:
[root@neteye1 conf]# cat /neteye/shared/logstash/conf/translate/syslog.yml
SOURCE IP: “as400”
adding the various source IPs as we did in the 01_logstash.conf configuration file above.
We next add the AS400 filter in the main logstash pipeline that allows you to have the data in ECS format. For example with an AS400 in Italian you can use this file which must be inserted at the path /neteye/shared/logstash/conf/conf.d :
filter {
if [type] == "syslog" and [message] =~ /.*Operazione.*/ {
   mutate {
        add_field => { "[event][category]" => "authentication" }
   }
   if [message] =~ /.*Log IN.*/ {
       mutate {
               add_field => [ "[event][type]", "start" ]
               add_field => [ "[event][action]", "logged-in" ]
               add_field => [ "[event][outcome]", "success" ]
       }
   }
   if [message] =~ /.*Password Errata.*/ {
       mutate {
               add_field => [ "[event][type]", "start" ]
               add_field => [ "[event][action]", "logon-failed" ]
               add_field => [ "[event][outcome]", "failure" ]
       }
   }
   if [message] =~ /.*Log OUT.*/ {
       mutate {
               add_field => [ "[event][type]", "end" ]
               add_field => [ "[event][action]", "logged-out" ]
               add_field => [ "[event][outcome]", "success" ]
       }

   }
   grok {
                match=> {
                        "message" => [
                                "Sistema:%{DATA:[host][name]} Utente:%{DATA:[user][name]} .* Postazione:%{GRE        EDYDATA:[client][address]}"
                        ]
                }
        }

  }
}
Once this is done you can restart logstash and then can proceed to log on / log off / failed logon on the AS400 machine. After you do that and verify that there are no errors in the log files, you can proceed to check for the presence of the data in the membership index.
Since we’ve now created ECS-compliant data, we have the possibility to correlate the data with other data possibly present in the system in the Security app as can be seen in the following screens.
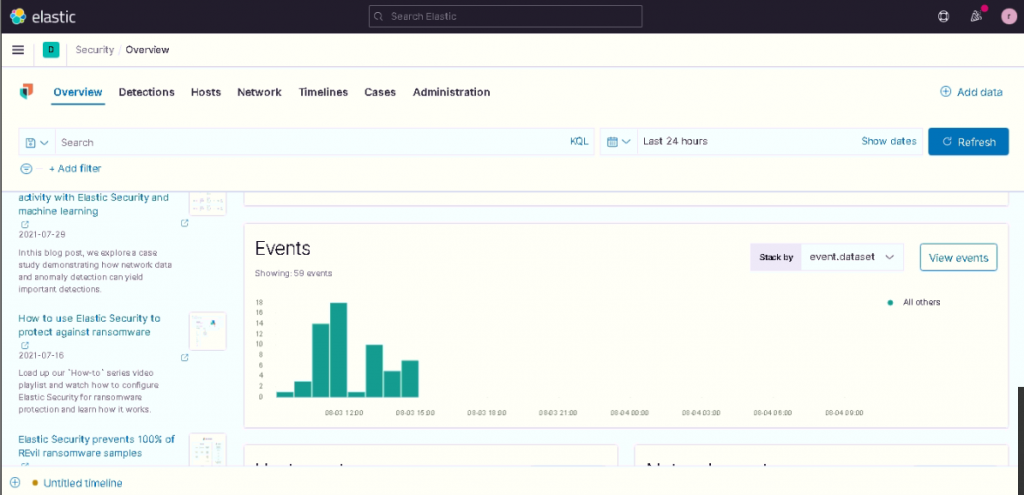
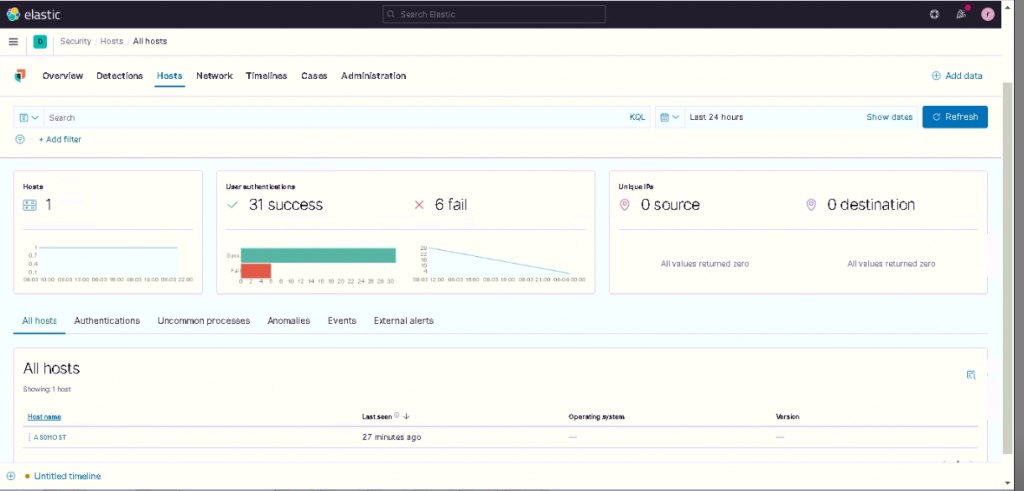
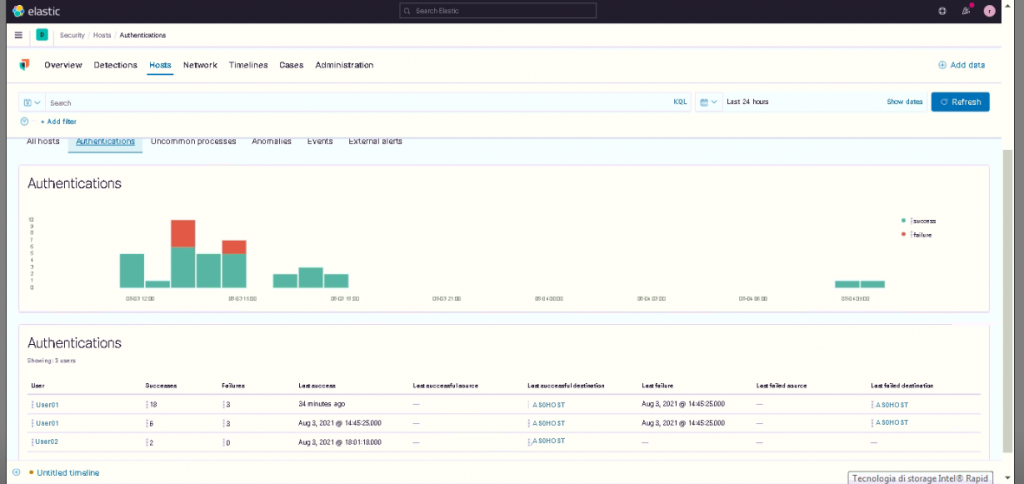
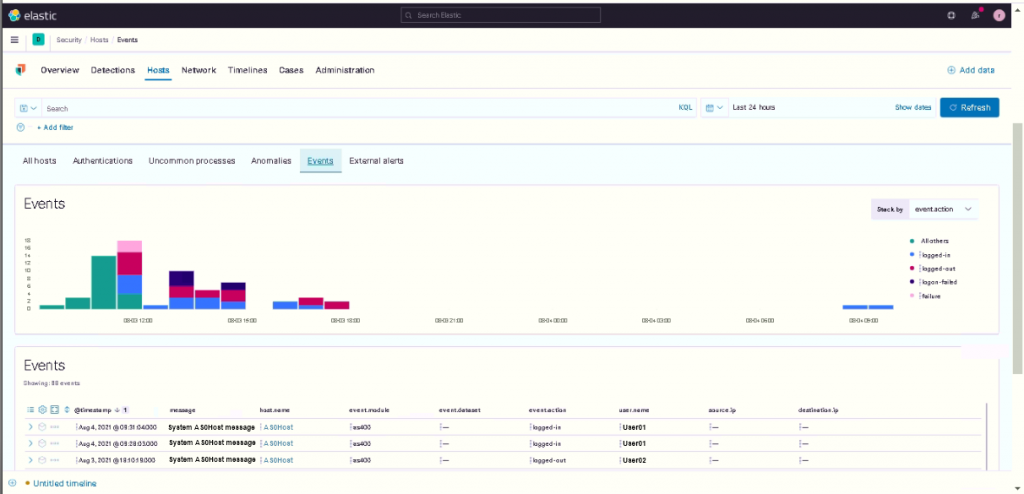
With this data it’s therefore possible to build Machine Learning jobs and create detection rules.
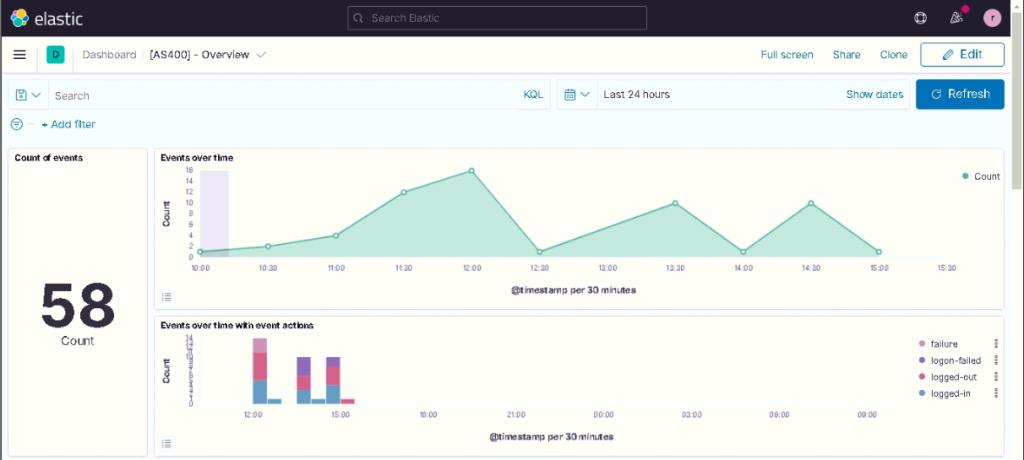
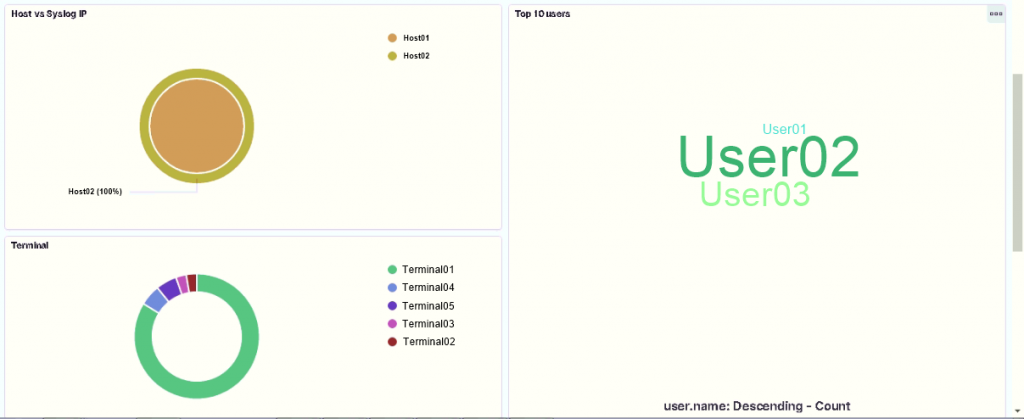
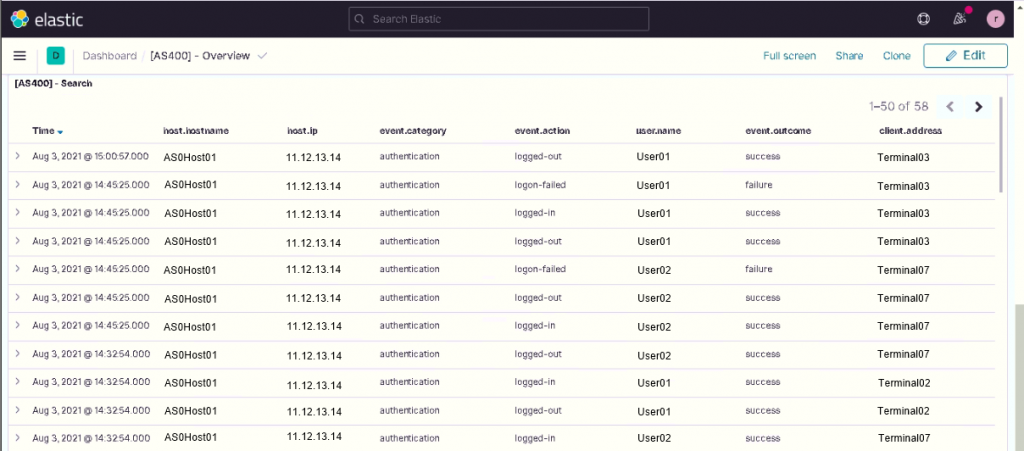
We also created an overview dashboard to display the collected data you see below.
Finally, it’s possible to enable the blockchain by using the specific component present in NetEye called El Proxy by following the online guide.
Franco Federico
Hi, I’m Franco and I was born in Monza. For 20 years I worked for IBM in various roles. I started as a customer service representative (help desk operator), then I was promoted to Windows expert. In 2004 I changed again and was promoted to consultant, business analyst, then Java developer, and finally technical support and system integrator for Enterprise Content Management (FileNet). Several years ago I became fascinated by the Open Source world, the GNU\Linux operating system, and security in general. So for 4 years during my free time I studied security systems and computer networks in order to extend my knowledge. I came across several open source technologies including the Elastic stack (formerly ELK), and started to explore them and other similar ones like Grafana, Greylog, Snort, Grok, etc. I like to script in Python, too. Then I started to work in Würth Phoenix like consultant. Two years ago I moved with my family in Berlin to work for a startup in fintech(Nuri), but the startup went bankrupt due to insolvency. No problem, Berlin offered many other opportunities and I started working for Helios IT Service as an infrastructure monitoring expert with Icinga and Elastic, but after another year I preferred to return to Italy for various reasons that we can go into in person 🙂 In my free time I continue to dedicate myself to my family(especially my daughter) and I like walking, reading, dancing and making pizza for friends and relatives.
Author
Latest posts by Franco Federico
10. 06. 2026
Unified Monitoring
Transform Metrics into Alerts
10. 03. 2026
Unified Monitoring
Elastic AutoOps in NetEye: Simplifying Elasticsearch Operations with Real-Time Intelligence
09. 09. 2025
NetEye
Backing up a MariaDB Galera Cluster
12. 06. 2025
NetEye, Unified Monitoring
From Monitoring to SOC