18. 03. 2025
Icinga Web 2, ITOA, NetEye, UI, Unified Monitoring

Scenario
JBoss Application Server (JBoss AS) is an open-source, cross-platform Java application server developed by JBoss, a division of Red Hat, Inc. JBoss AS is an open-source implementation of Java 2 Enterprise Edition (J2EE) that is used for implementing Java applications and other Web-based applications.
Being a Java web-based application, it’s important to keep it monitored to avoid performance issues.
Fortunately, a lot of real time information can be collected through the Jolokia Agent which can be deployed inside the JBoss AS instance.
Just download and install the latest version of the Jolokia WAR-Agent from: https://jolokia.org/download.html.
Performance Data
You will need to enable statistics from the following two subsystems:
- Data Sources
- Web/HTTP – Undertow
You can use the JBoss Management UI to enable the collection and reporting of these statistics.
Given a centralized monitoring solution like NetEye, it would be nice to collect and present the metrics collected by the Jolokia agent.
How To Get Started
The easiest way to collect the Jolokia data and sent it to NetEye is through a Telegraf agent.
Just install the Telegraf agent on the JBoss AS and use the attached sample configuration file.
Remember to configure within
the section [[inputs.jolokia2_agent]]
the right Jolokia role username, password and the URL value of your JBoss
server.
If you have more than one URL, separate the values with commas.
The section [[outputs.influxdb]] or, even better, [[outputs.nats]] must also be adjusted to connect to the NetEye server.
The collected data will be stored in an Influx database (remember to set
the right data retention policy to avoid uncontrolled growth in the DB!), ready
to be displayed through the Grafana web interface.
Presenting Data with Grafana
Attached you’ll also find a Grafana dashboard that can be directly imported into NetEye.
This is in Grafana 5 format, so be sure that if you still have a NetEye 3 installation, that you update your system! You can find the .json file here.
Of course, the Dashboard can be customized and integrated with other metrics.
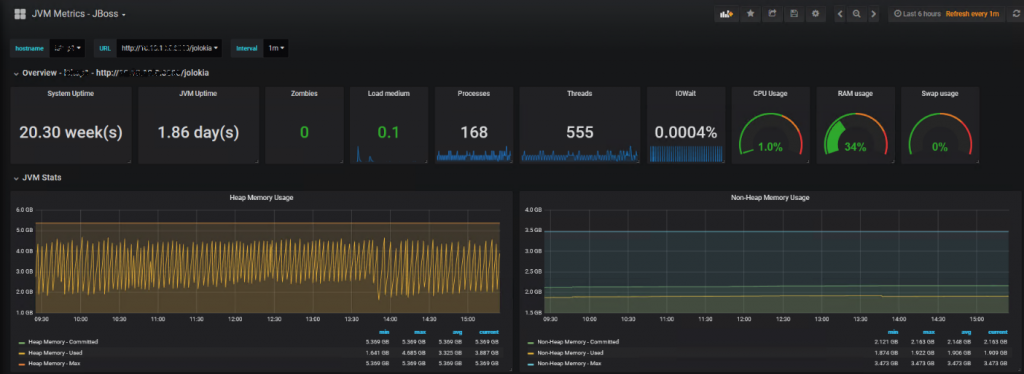
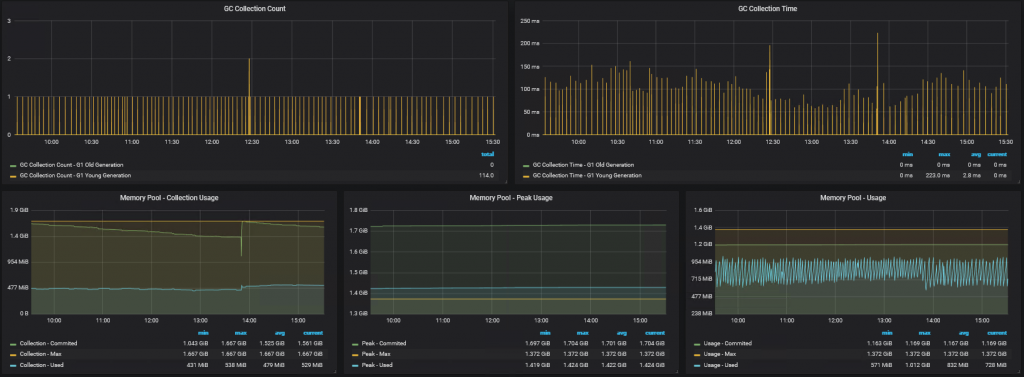
JVM Stats:
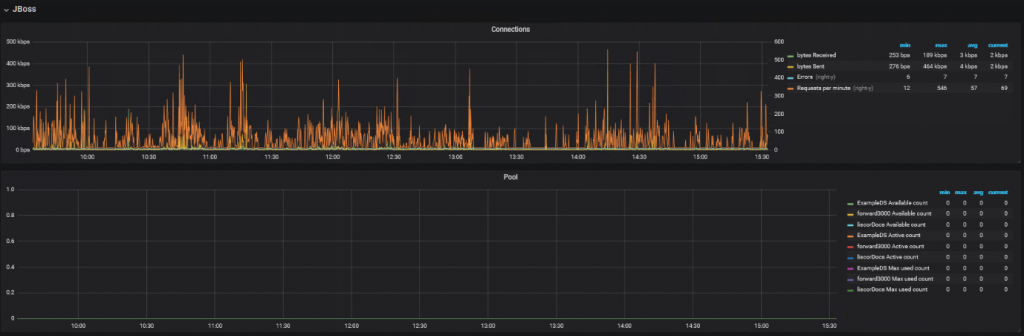
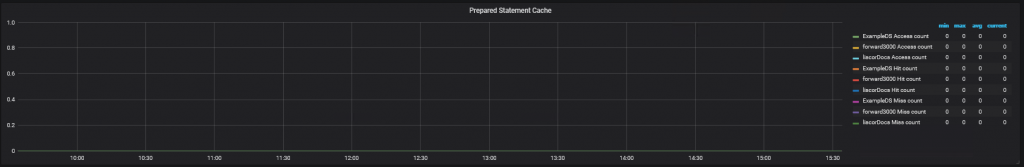
JBoss:
A number of metrics are collected by the Jolokia agent, and others can be added. I advise you to take a deeper look at Jolokia to find other interesting ones.
JBoss-telegraf-sample.conf
Telegraf configuration
 Telegraf is entirely plugin driven. All metrics are gathered from the
 declared inputs, and sent to the declared outputs.
 Plugins must be declared in here to be active.
 To deactivate a plugin, comment out the name and any variables.
 Use 'telegraf -config telegraf.conf -test' to see what metrics a config
 file would generate.
 Global tags can be specified here in key="value" format.
 [global_tags]
   # dc = "us-east-1" # will tag all metrics with dc=us-east-1
   # rack = "1a"
 Configuration for telegraf agent
 [agent]
   ## Default data collection interval for all inputs
   interval = "5s"
   ## Rounds collection interval to 'interval'
   ## ie, if interval="10s" then always collect on :00, :10, :20, etc.
   round_interval = true
 ## Telegraf will cache metric_buffer_limit metrics for each output, and will
   ## flush this buffer on a successful write.
   metric_buffer_limit = 1000
   ## Flush the buffer whenever full, regardless of flush_interval.
   flush_buffer_when_full = true
 ## Collection jitter is used to jitter the collection by a random amount.
   ## Each plugin will sleep for a random time within jitter before collecting.
   ## This can be used to avoid many plugins querying things like sysfs at the
   ## same time, which can have a measurable effect on the system.
   collection_jitter = "0s"
 ## Default flushing interval for all outputs. You shouldn't set this below
   ## interval. Maximum flush_interval will be flush_interval + flush_jitter
   flush_interval = "60s"
   ## Jitter the flush interval by a random amount. This is primarily to avoid
   ## large write spikes for users running a large number of telegraf instances.
   ## ie, a jitter of 5s and interval 10s means flushes will happen every 10-15s
   flush_jitter = "0s"
 ## Logging configuration:
   ## Run telegraf in debug mode
   debug = false
   ## Run telegraf in quiet mode
   quiet = false
   ## Specify the log file name. The empty string means to log to stdout.
   logfile = "/Program Files/Telegraf/telegraf.log"
 ## Override default hostname, if empty use os.Hostname()
   # hostname = ""
 #
 OUTPUTS
 #
 [[outputs.nats]]
 servers = ["nats://datacollector.xxx.xxx:4222"]
 subject = "telegraf"
 data_format = "influx"
 Configuration for influxdb server to send metrics to
 [[outputs.influxdb]]
   # The full HTTP or UDP endpoint URL for your InfluxDB instance.
   # Multiple urls can be specified but it is assumed that they are part of the same
   # cluster, this means that only ONE of the urls will be written to each interval.
   # urls = ["udp://localhost:8089"] # UDP endpoint example
 urls = ["http://neteye.xxx.xxx:8086"] # required
   # The target database for metrics (telegraf will create it if not exists)
 database = "telegraf" # required
   # Precision of writes, valid values are "ns", "us" (or "µs"), "ms", "s", "m", "h".
   # note: using second precision greatly helps InfluxDB compression
 precision = "s"
 ## Write timeout (for the InfluxDB client), formatted as a string.
   ## If not provided, will default to 5s. 0s means no timeout (not recommended).
 timeout = "5s"
   # username = "telegraf"
   # password = "metricsmetricsmetricsmetrics"
   # Set the user agent for HTTP POSTs (can be useful for log differentiation)
   # user_agent = "telegraf"
   # Set UDP payload size, defaults to InfluxDB UDP Client default (512 bytes)
   # udp_payload = 512
 #
 INPUTS
 #
 [[inputs.system]]
 [[inputs.processes]]
 [[inputs.cpu]]
   ## Whether to report per-cpu stats or not
   percpu = true
   ## Whether to report total system cpu stats or not
   totalcpu = true
   ## If true, collect raw CPU time metrics.
   collect_cpu_time = false
   ## If true, compute and report the sum of all non-idle CPU states.
   report_active = false
 [[inputs.mem]]
 [[inputs.swap]]
 [[inputs.jolokia2_agent]]
 urls = ["http://1.1.1.1:8080/jolokia"]
 name_prefix = "jboss."
 username and password are mandatory for Jolokia 1.6 or later
 username = "jolokia-user"
 password = "jolokia-password"
 JVM Generic
 [[inputs.jolokia2_agent.metric]]
 name  = "OperatingSystem"
 mbean = "java.lang:type=OperatingSystem"
 paths = ["ProcessCpuLoad","SystemLoadAverage","SystemCpuLoad"]
 [[inputs.jolokia2_agent.metric]]
 name  = "jvm_runtime"
 mbean = "java.lang:type=Runtime"
 paths = ["Uptime"]
 [[inputs.jolokia2_agent.metric]]
 name  = "jvm_memory"
 mbean = "java.lang:type=Memory"
 paths = ["HeapMemoryUsage", "NonHeapMemoryUsage", "ObjectPendingFinalizationCount"]
 [[inputs.jolokia2_agent.metric]]
 name     = "jvm_garbage_collector"
 mbean    = "java.lang:name=*,type=GarbageCollector"
 paths    = ["CollectionTime", "CollectionCount"]
 tag_keys = ["name"]
 [[inputs.jolokia2_agent.metric]]
 name       = "jvm_memory_pool"
 mbean      = "java.lang:name=*,type=MemoryPool"
 paths      = ["Usage", "PeakUsage", "CollectionUsage"]
 tag_keys   = ["name"]
 tag_prefix = "pool_"
 JBOSS
 [[inputs.jolokia2_agent.metric]]
 name     = "connectors_http"
 mbean    = "jboss.as:https-listener=,server=,subsystem=undertow"
 paths    = ["bytesReceived","bytesSent","errorCount","requestCount"]
 tag_keys = ["server","https-listener"]
 [[inputs.jolokia2_agent.metric]]
 name     = "connectors_http"
 mbean    = "jboss.as:http-listener=,server=,subsystem=undertow"
 paths    = ["bytesReceived","bytesSent","errorCount","requestCount"]
 tag_keys = ["server","http-listener"]
 [[inputs.jolokia2_agent.metric]]
 name     = "datasource_jdbc"
 mbean    = "jboss.as:data-source=*,statistics=jdbc,subsystem=datasources"
 paths    = ["PreparedStatementCacheAccessCount","PreparedStatementCacheHitCount","PreparedStatementCacheMissCount"]
 tag_keys = ["data-source"]
 [[inputs.jolokia2_agent.metric]]
 name     = "datasource_pool"
 mbean    = "jboss.as:data-source=*,statistics=pool,subsystem=datasources"
 paths    = ["AvailableCount","ActiveCount","MaxUsedCount"]
 tag_keys = ["data-source"]
Alessandro Romboli
Site Reliability Engineer at Würth IT Italy
My name is Alessandro and I joined Würth Phoenix (now Würth IT Italy) early in 2013. I have over 20 years of experience in the IT sector: For a long time I've worked for a big Italian bank in a very complex environment, managing the software provisioning for all the branch offices. Then I've worked as a system administrator for an international IT provider supporting several big companies in their infrastructures, providing high availability solutions and disaster recovery implementations. I've joined the VMware virtual infrastructure in early stage, since version 2: it was one of the first productive Server Farms in Italy. I always like to study and compare different technologies: I work with Linux, MAC OSX, Windows and VMWare. Since I joined Würth Phoenix, I could also expand my experience on Firewalls, Storage Area Networks, Local Area Networks, designing and implementing complete solutions for our customers. Primarily, I'm a system administrator and solution designer, certified as VMware VCP6 DCV, Microsoft MCP for Windows Server, Hyper-V and System Center Virtual Machine Manager, SQL Server, SharePoint. Besides computers, I also like photography, sport and trekking in the mountains.
Author
Latest posts by Alessandro Romboli
17. 06. 2026
Microsoft
UEFI Secure Boot Nightmare
03. 12. 2025
Microsoft
Single Sign-On for Power BI Report Server
08. 09. 2025
Service Management
VMware ESXi Transparent Page Sharing
12. 06. 2025
Microsoft
Terminal Server User Profiles with FSLogix