
:max_bytes(150000):strip_icc()/erasing-equations-on-blackboard-jeffrey-coolidge-stone-getty-images-56a6fad35f9b58b7d0e5d182-ca5c04dd15834300adfff73c105f05a3.jpg)
InfluxDB is the database used in NetEye for saving performance data. It guarantees graphic visibility of the data (thanks to the Grafana frontend) and it is very important that the data stored is useful.
I’ll give you an example of how simple it can be to produce obsolete data in Influx:
Suppose I create a host, to which I attach the check_http service. Both generate data on Influx through check commands (the host through the hostalive command, the check_http service through the http command).
After some minutes suppose I then decide to delete this host and the related service. On NetEye I will no longer see anything, but on Influx the data remains there, waiting for someone to sooner or later (within the retention policy deadline) look at it.
But… do we really need all that obsolete data?
Personally I want to be able to manage 100% of my data and decide quickly for myself when to delete this data. For this reason I decided to develop, supported by our developer consultant Tommaso Fontana, a plugin that can delete all the garbage present in InfluxDB. And I assure you that I found some unbelievable data … Now I’ll explain how it works:
[root@neteye.local influx_db_sanitization_scripts]# ./drop_dead_values --help
usage: -c [-h] [-v VERBOSITY] [-dr] [-f] [-dsp DB_SETTINGS_PATH] [-t MAX_TIME]
          [-H HOSTNAME [HOSTNAME ...]] [-s SERVICE [SERVICE ...]] [-m METRIC]
          [-M MEASUREMENT] [-w WORKERS] [-p] [-snn]

Example:
./drop_dead_values -dr -t 15w -v 1 -w 5 -M ping -snn

If had no new data in the last 15 weeks on the measurement "ping"
drop the values (grouped by hostname, service, and metric).
Set verbosity to 1 (WARNING) and set 5 workers for parallel analysis.
-ssn since in this case the service tag can't be null.

optional arguments:
  -h, --help            show this help message and exit
  -v VERBOSITY, --verbosity VERBOSITY
                        Verbosity of the program. 0 - Critical, 1 - Warnings, 2 - Info, 3 - Debug
  -dr, --dryrun         Test run, access the DB in read only mode.
  -f, --force           No not show the are you sure prompt.
  -dsp DB_SETTINGS_PATH, --db-settings-path DB_SETTINGS_PATH
                        Path to the json with the settings for the DB connections.
  -t MAX_TIME, --max-time MAX_TIME
                        Threshold time, if a measurement has no points newer than the threshold
  -H HOSTNAME [HOSTNAME ...], --hostname HOSTNAME [HOSTNAME ...]
                        The hostname to select
  -s SERVICE [SERVICE ...], --service SERVICE [SERVICE ...]
                        The service to select
  -m METRIC, --metric METRIC
                        The metric to select
  -M MEASUREMENT, --measurement MEASUREMENT
                        The measurement to select
  -w WORKERS, --workers WORKERS
                        How many query to execute in parallel
  -p, --use-processes   If the parallelization should use threads or processes
  -snn, --service-not-nullable
                        if the service can be null or not
The idea is to establish a time “X” such that, in the absence of updated data, I can decide to eliminate all the metrics associated with a particular object.
In the example shown we will count how many metrics of the “http” measurements have not been updated over the last 150 days:
[root@neteye.local]# ./drop_dead_values -dr -t 150d -v 2 -M http -v 1 -w 10 -p -f | wc -l
350
There are 350 metrics that have data that has not been updated in over 6 months. Unbelievable!
Now let’s visualize some details, examining one particular object:
[root@neteye.local]# ./drop_dead_values -dr -t 150d -M http -v 1 -w 10 -p -f
WARNING:main.py:drop_dead_values_specific:86:Not found values for measurement [http] hostname [www.garbagesite.it] service [generic_http] metric [size]
WARNING:main.py:drop_dead_values_specific:86:Not found values for measurement [http] hostname [www.garbagesite.it] service [] metric []
WARNING:main.py:drop_dead_values_specific:86:Not found values for measurement [http] hostname [www.garbagesite.it] service [generic_http] metric [time]
WARNING:main.py:drop_dead_values_specific:86:Not found values for measurement [http] hostname [www.garbagesite.it] service [generic_http] metric []
We can increase the verbosity in order to have more visibility:
[root@neteye.local]# ./drop_dead_values -dr -t 150d -M http -v 2 -w 10 -p -f
INFO:main.py:drop_dead_values_specific:83:Found values for measurement [http] hostname [www.garbagesite.it] service [http_website_availability] metric [size] in the last [5 months]
INFO:main.py:drop_dead_values_specific:79:Analyzing M[http] h[www.garbagesite.it] s[http_website_availability] m[time]
INFO:main.py:drop_dead_values_specific:83:Found values for measurement [WARNING:main.py:drop_dead_values_specific:86:Not found values for measurement [http] hostname [www.garbagesite.it] service [generic_http] metric [size]
INFO:main.py:drop_dead_values_specific:79:Analyzing M[http] h[www.garbagesite.it] s[generic_http] m[time]
WARNING:main.py:drop_dead_values_specific:86:Not found values for measurement [http] hostname [www.garbagesite.it] service [] metric []
WARNING:main.py:drop_dead_values_specific:86:Not found values for measurement [http] hostname [www.garbagesite.it] service [generic_http] metric [time]
INFO:main.py:drop_dead_values_specific:79:Analyzing M[http] h[www.garbagesite.it] s[generic_http] m[]
WARNING:main.py:drop_dead_values_specific:86:Not found values for measurement [http] hostname [www.garbagesite.it] service [generic_http] metric []
Now we can go check it directly in InfluxDB:
> select hostname,value from http where hostname = 'www.garbagesite.it' and metric = 'size'
name: http
time                hostname          value
----                --------          -----
1570698748000000000 www.garbagesite.it 486
1570698765000000000 www.garbagesite.it 486
1570698920000000000 www.garbagesite.it 486
1570698936000000000 www.garbagesite.it 486
1570699091000000000 www.garbagesite.it 486
1570699106000000000 www.garbagesite.it 486
1570699263000000000 www.garbagesite.it 486
1570699435000000000 www.garbagesite.it 486
1570699448000000000 www.garbagesite.it 486
1570699607000000000 www.garbagesite.it 486
1570699619000000000 www.garbagesite.it 486
1570699783000000000 www.garbagesite.it 486
1570699796000000000 www.garbagesite.it 486
1570699959000000000 www.garbagesite.it 486
1570699973000000000 www.garbagesite.it 486
1570700136000000000 www.garbagesite.it 486
1570700150000000000 www.garbagesite.it 486
1570700312000000000 www.garbagesite.it 486
1570700327000000000 www.garbagesite.it 486
1570700489000000000 www.garbagesite.it 486
1570700504000000000 www.garbagesite.it 486
1570700681000000000 www.garbagesite.it 486
1571041227000000000 www.garbagesite.it 474
1571041231000000000 www.garbagesite.it 474
1571041285000000000 www.garbagesite.it 474
1571041289000000000 www.garbagesite.it 474
1571041457000000000 www.garbagesite.it 474
1571041464000000000 www.garbagesite.it 474
1571041629000000000 www.garbagesite.it 474
1571041639000000000 www.garbagesite.it 474
1571041802000000000 www.garbagesite.it 474
1571041814000000000 www.garbagesite.it 474
1571041974000000000 www.garbagesite.it 474
1571041989000000000 www.garbagesite.it 474
1571042124000000000 www.garbagesite.it 474
1571042132000000000 www.garbagesite.it 474
1571042298000000000 www.garbagesite.it 474
1571042305000000000 www.garbagesite.it 474
1571042471000000000 www.garbagesite.it 474
1571042478000000000 www.garbagesite.it 474
1571042645000000000 www.garbagesite.it 474
1571042651000000000 www.garbagesite.it 474
1571042821000000000 www.garbagesite.it 474
1571042824000000000 www.garbagesite.it 474
The last value has a very old date:
[root@neteye.local ~]# date -d @1571042824
Mon Oct 14 10:47:04 CEST 2019
So let’s go check this data in Grafana:
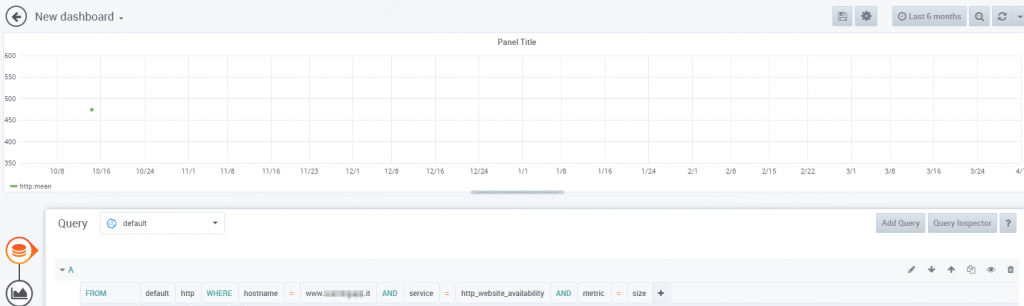
Zoom in a little to the point on the left…
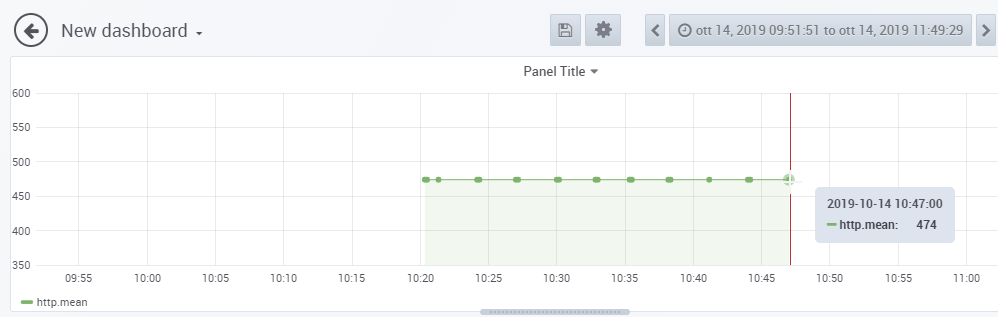
Now we are sure that the plugin is telling us the truth and we can go remove all the performance data that has not been updated for 6 months.
We only need to remove the argument -dr (dry-run), and if we want we can specify a particular host/service/metric with precise arguments:
./drop_dead_values -t 150d -M http -v 2 -w 10 -p -H www.garbagesite.it -s http_website_availability
This could delete data. Please make a backup if you don't already have one.
Do you want to continue? [y/N]
y
INFO:data_getter.py:__init__:21:Loading the DB settings from [/data/influx_db_sanitization_scripts/db_settings.json]
INFO:data_getter.py:__init__:27:Conneting to the DB on [influxdb.neteyelocal:8086] for the database [icinga2]
INFO:main.py:drop_dead_values_per_measurement:58:Found hostnames ['www.garbagesite.it']
INFO:main.py:drop_dead_values_per_measurement:68:Found services [['http_website_availability']] for hostname [www.garbagesite.it]
INFO:main.py:drop_dead_values_specific:77:Found metrics [['size', 'time', '']] for hostname [www.garbagesite.it] service [http_website_availability]
INFO:main.py:drop_dead_values_specific:79:Analyzing M[http] h[www.garbagesite.it] s[http_website_availability] m[size]
WARNING:main.py:drop_dead_values_specific:86:Not found values for measurement [http] hostname [www.garbagesite.it] service [http_website_availability] metric [size]
INFO:main.py:drop_dead_values_specific:79:Analyzing M[http] h[www.garbagesite.it] s[http_website_availability] m[time]
WARNING:main.py:drop_dead_values_specific:86:Not found values for measurement [http] hostname [www.garbagesite.it] service [http_website_availability] metric [time]
INFO:main.py:drop_dead_values_specific:79:Analyzing M[http] h[www.garbagesite.it] s[http_website_availability] m[]
WARNING:main.py:drop_dead_values_specific:86:Not found values for measurement [http] hostname [www.garbagesite.it] service [http_website_availability] metric []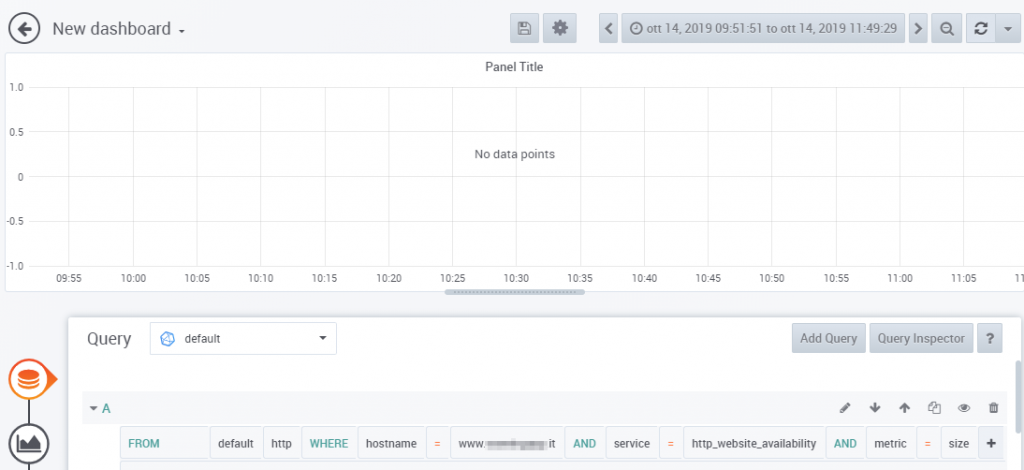
In this example we have specified one particular measurement, but if we don’t specify any, then the plugin will sanitize all the measurements.
It’s important to maintain this sanitization daily. For this I recommend creating an Icinga check that runs once per night.
For more information, you can visit the GitHub project of our developer Tommaso Fontana.


Stefano Bruno
Consultant at Würth Phoenix
Dear all, I'm Stefano and I was born in Milano.
Since I was a little boy I've always been fascinated by the IT world. My first approach was with a 286 laptop with a 16 color graphic adapter (the early '90s).
Before joining Würth Phoenix as SI consultant, I worked first as IT Consultant, and then for several years as Infrastructure Project Manager, with a strong knowledge in the global IT scenarios: Datacenter consolidation/migration, VMware, monitoring systems, disaster recovery, backup system.
My various ITIL and TOGAF certification allowed me to be able to cooperate in the writing of many ITSM Processes.
I like to play guitar, soccer and cycling, but... my very passion are my 3 baby and my lovely wife that has always encouraged me and helped me to realize my dreams.
Author
Latest posts by Stefano Bruno
13. 07. 2020
NetEye, Service Management, SLM, Unified Monitoring
ITSM Ticketing Integration with NetEye