15. 06. 2026
NetEye, Unified Monitoring

Within Internet provider companies, very often we are asked to calculate the amount of Internet bandwidth in order to bill any excess use of bandwidth to each customer.
We decided to make this calculation completely customizable using NetEye together with the built-in tools Icinga2, InfluxDB and Grafana.
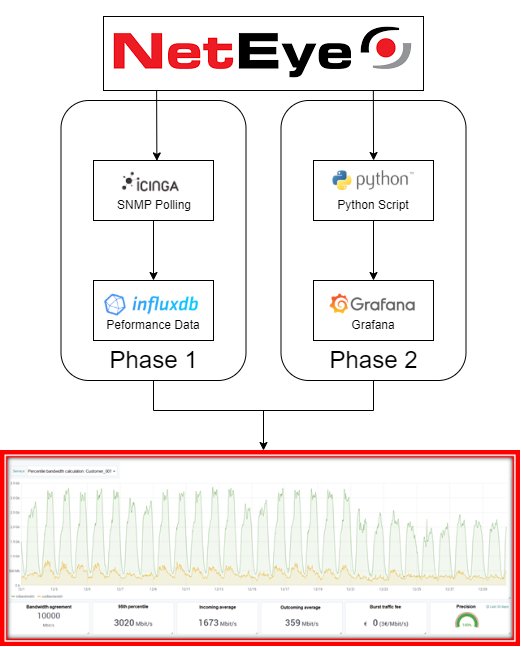
Phase 1
- Using an SNMP check, we measure the bandwidth utilized by performing active polling
- The performance data is saved in an InfluxDB data base
Phase2
We developed a Python plugin which takes care of recovering performance data from InfluxDB and processing it in order to calculate the following parameters:
- 95th percentile
- Incoming Bandwidth (average)
- Outgoing Bandwidth (average)
- Burstable Billing
- Precision
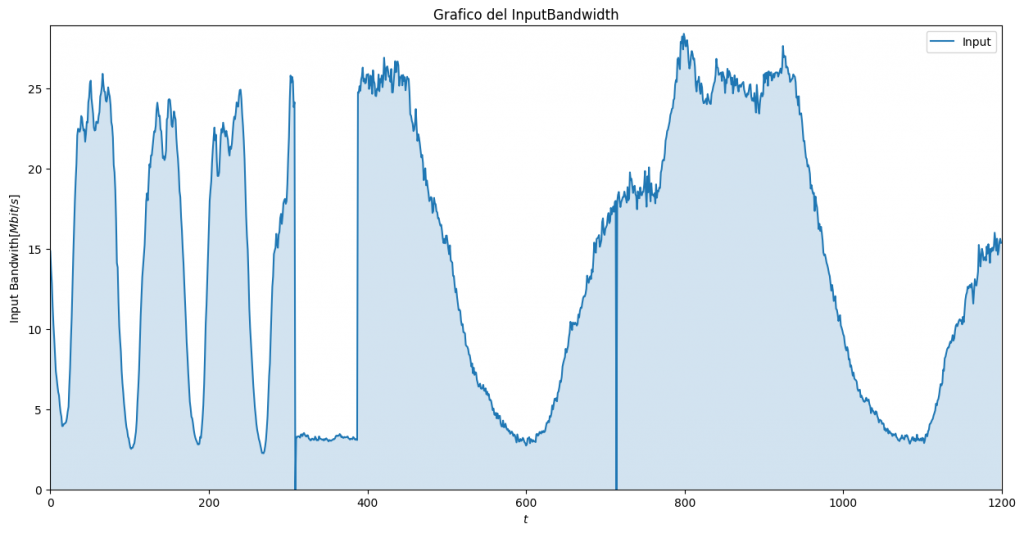
95th Percentile Calculation
Suppose we have the following bandwidth data input from a switch:
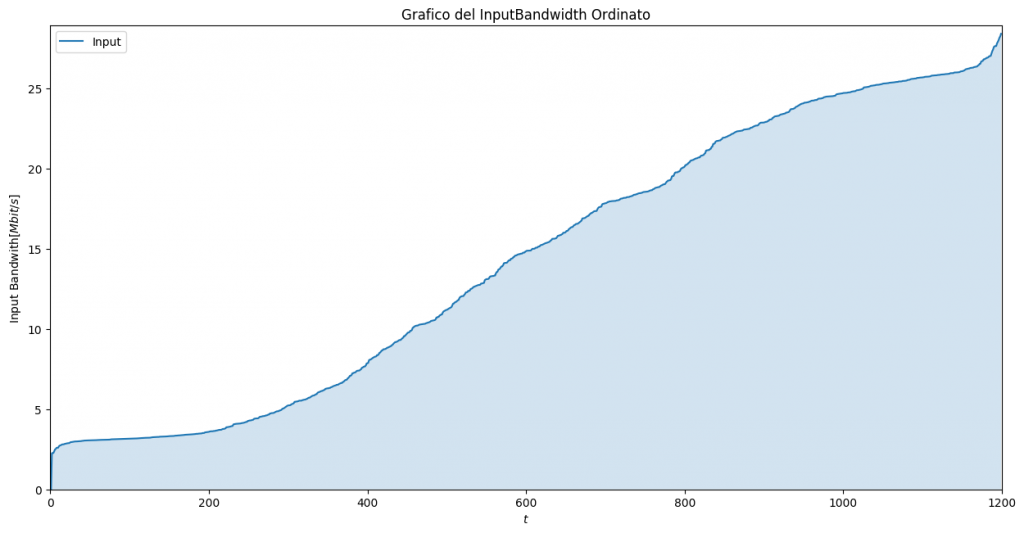
To calculate a quantile, the first thing to do is to sort all the values from the smallest to the largest:
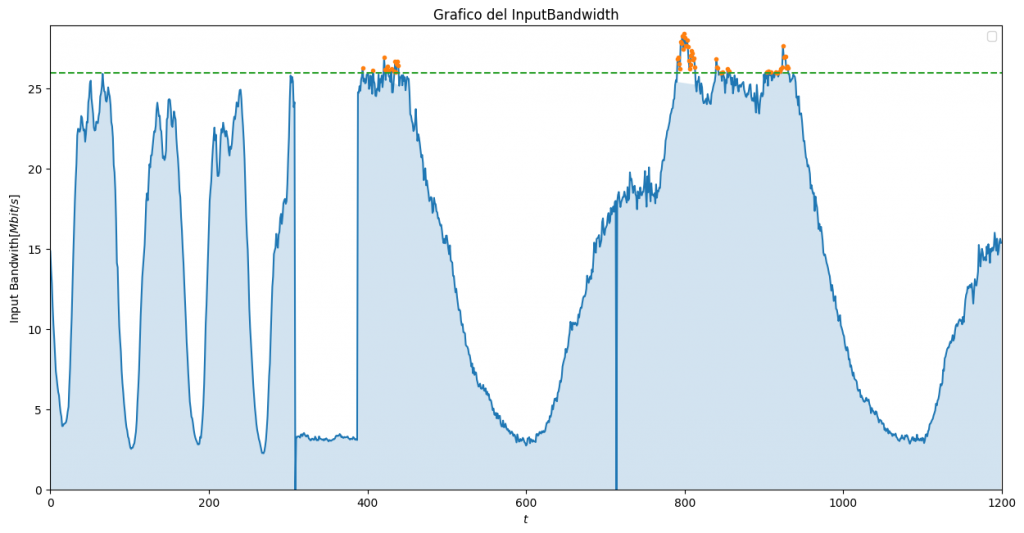
Now in this graph, the 95th percentile is that value on the X axis where 5% are larger values and 95% are smaller values.
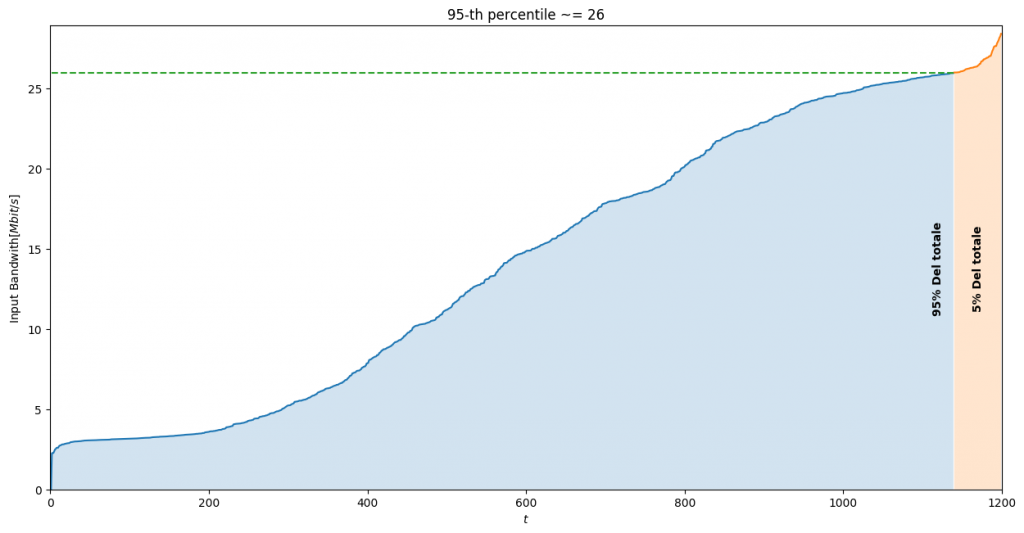
Once we find that point, we will have 5% of values on the right and 95% of values on the left.
Which translates into the fact that on the original chart we will have 5% of the points above the quantile and 95% of the points below it:
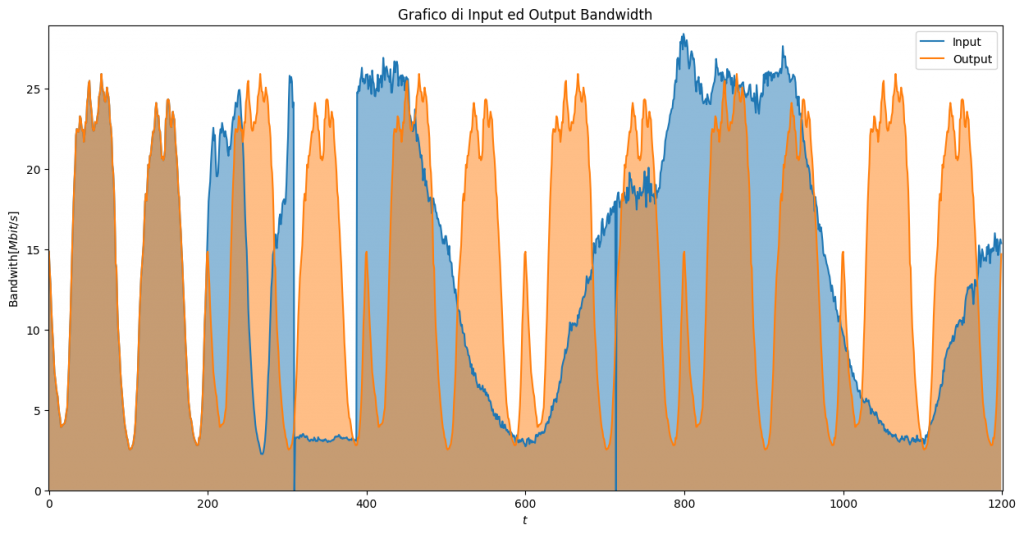
How Do We Aggregate Input and Output?
In the example above of the switch, we will have both input and output bandwidth:
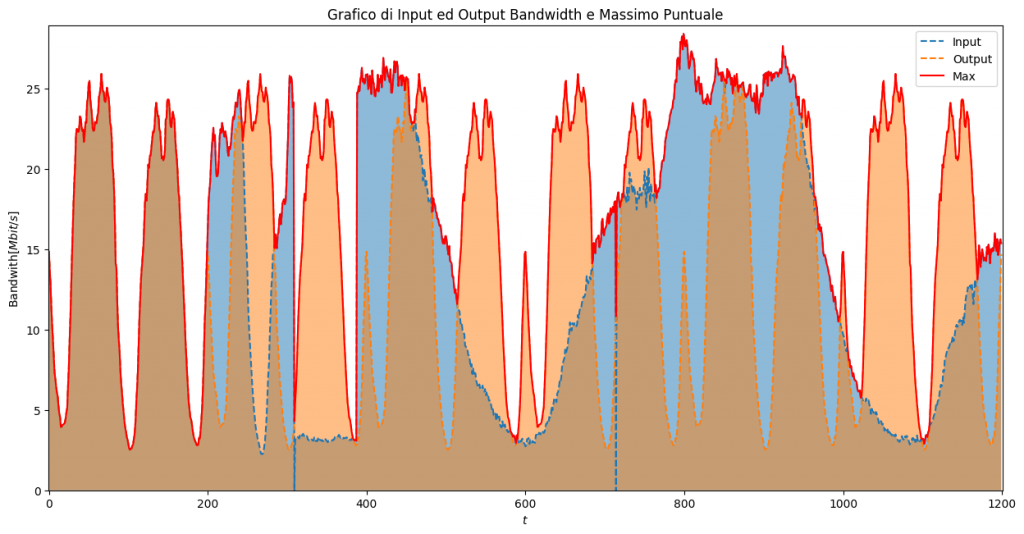
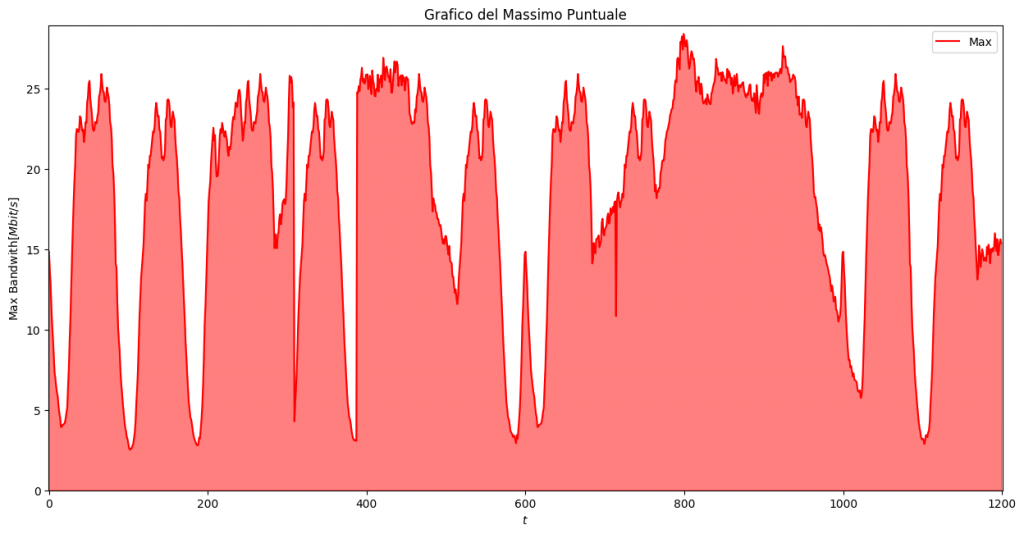
What we are going to do is take the combined maximum, therefore for each instant of time we take the maximum value of both input and output:
The resulting graph is:
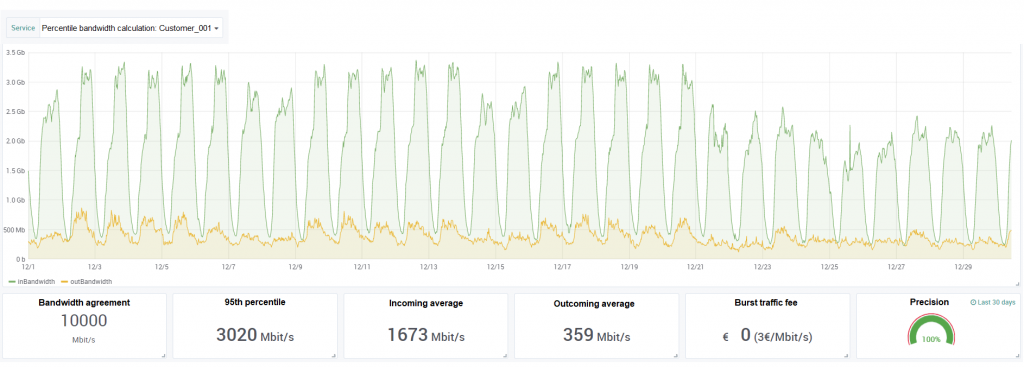
And finally, this is the output shown in our Grafana web interface:
The script is very customizable. Here’s the output of the help command:
$ ./bin/quantile_checker -h
usage: main.py [-h] -M MEASUREMENT -HS HOSTNAME_SERVICE [-I INPUT] [-O OUTPUT]
               [-rc] [-rcp REPORT_CSV_PATH] -m MAX -p PENALTY [-q QUANTILE]
               [-t TIME] [-v {0,1,2}]

QuantileChecker is a free software developed by Tommaso Fontana for Wurth
Phoenix S.r.l. under GPL-2 License.

optional arguments:
  -h, --help            show this help message and exit

required settings:
  -M MEASUREMENT, --measurement MEASUREMENT
                        Measurement where the data will be queried.
  -HS HOSTNAME_SERVICE, --hostname-service HOSTNAME_SERVICE
                        The hostname and service to select, those must be
                        passed as HOSTNAME|SERVICE. One can use this argument
                        multiple times to select multiple hosts and services

query settings:
  -I INPUT, --input INPUT
                        The name of the input bandwidth metric, default-
                        value='inBandwidth'
  -O OUTPUT, --output OUTPUT
                        The name of the output bandwidth metric, default-
                        value='outBandwidth'
  -rc, --report-csv     Flag, if enabled the data read from the DB are dumped
                        as a CSV
  -rcp REPORT_CSV_PATH, --report-csv-path REPORT_CSV_PATH
                        Path where to save the data used, default-value='./'

Fee settings:
  -m MAX, --max MAX     The maxiumum ammount of Bandwidth usable in Mbit/s
  -p PENALTY, --penalty PENALTY
                        The fee in euros/(Mbit/s) in case of the threshold is
                        exceded
  -q QUANTILE, --quantile QUANTILE
                        The quantile to confront with the threshold. it must
                        be between 0 and 1. The default value is 0.95 so the
                        95th percentile
  -t TIME, --time TIME  The timewindow to calculate the percentile, if not
                        specified it is considered the time from the first day
                        of the current month.

verbosity settings (optional):
  -v {0,1,2}, --verbosity {0,1,2}
                        set the logging verbosity, 0 == CRITICAL, 1 == INFO, 2
                        == DEBUG it defaults to ERROR.
For more information, you can visit the GitHub project of our developer Tommaso Fontana.

Stefano Bruno
Consultant at Würth Phoenix
Dear all, I'm Stefano and I was born in Milano.
Since I was a little boy I've always been fascinated by the IT world. My first approach was with a 286 laptop with a 16 color graphic adapter (the early '90s).
Before joining Würth Phoenix as SI consultant, I worked first as IT Consultant, and then for several years as Infrastructure Project Manager, with a strong knowledge in the global IT scenarios: Datacenter consolidation/migration, VMware, monitoring systems, disaster recovery, backup system.
My various ITIL and TOGAF certification allowed me to be able to cooperate in the writing of many ITSM Processes.
I like to play guitar, soccer and cycling, but... my very passion are my 3 baby and my lovely wife that has always encouraged me and helped me to realize my dreams.
Author
Latest posts by Stefano Bruno
13. 07. 2020
NetEye, Service Management, SLM, Unified Monitoring
ITSM Ticketing Integration with NetEye