
21. 08. 2020
Nicola Degara
NetEye, Service Management, SLM, Unified Monitoring
The NetEye and Jira Cloud Ecosystem Is Even More Integrated

Between one trial run and another, in these summer days I’ve also taken my time to deepen the theme on the interaction between NetEye 4 and ticketing systems. For my tests I chose the Jira Service Desk Cloud, and I must honestly say that the result achieved was satisfactory 🙂
As a method of integration I chose to use Webhooks which on the Jira side are very simple to configure and activate.
NetEye, thanks to the Tornado module (stable version NetEye 4.12), is able to receive, filter and correlate the information arriving from various services in JSON format.
Tornado is an Open Source Complex Event Processor (project link) that receives reports of events from data sources such as monitoring, email, telegraf, and ticketing systems, matches them against pre-configured rules, and executes the actions associated with those rules, which can include sending notifications, logging to files, and annotating events in a time series graphing system.
In my tests I decided to use Jira Service Desk cloud , since Würth Phoenix became an ATLASSIAN partner at the end of 2019.
For my test I could have also set it up to receive multiple WebHooks at the same time from different services, and based on the result choose the action to perform. But as a newbie I prefer, since it’s my first test, to keep it simple and hopefully effective 🙂
Given a payload, Tornado allows you to choose to consider the complete document, or to extract just one particular section of the document itself. Here too I took the easier way out, choosing to parse the whole document.
Tornado must be installed on your NetEye
STEP 1: Activate a WebHook Listener on NetEye
In order to let NetEye be able to receive Webhooks you should of course configure Tornado’s webhook_collector.
- In /neteye/shared/tornado_webhook_collector/conf/webhooks/ create a JSON file for the collector (e.g., jira_collector.json)
{
  "id": "anid",
  "token": "atoken",
  "collector_config": {
    "event_type": "issue_created",
    "payload": {
       "mydata":  "${@}"
    }
  }
}
- Restart the Tornado Webhook Collector
systemctl restart tornado_webhook_collector.serviceNow let’s take a look at what we have just configured:
- id: represents the name of the service that will be used to reach the collector
- token: for security reasons, you probably will want to limit incoming requests to those that are valid
- event_type: a tag to identify the type of event you want to receive
- mydata: “${@}“ means consider the whole payload that will be sent to match the rule. Of course, to improve performance you should reduce the scope by making the scope of the variable smaller
STEP 2: Increase Tornado Log Level
(This step is optional, but recommended because we are in a test scenario.)
If you want to more easily debug problems, then in /neteye/shared/tornado/conf/tornado.toml change the log level to debug and restart Tornado. You can then debug with:
journalctl -u tornado -fIn production, though, do not forget to restore the default output level configuration 🙂
STEP 3: Create and Configure the Parsing Rule in the Tornado GUI in NetEye
- Access the NetEye Tornado module GUI
- Go to the GUI Root folder
- Activate edit mode
- Add a new Rule
- Set a name and a description
- Insert a Constraint and an Action string in the Tornado GUI (for this part, refer to the use case below)
USE CASE: SLA Adjustment in SLM Module:
In a Jira/Jira Service Desk workflow step, in relation with a specific situation the Ticket Assignee should have the ability to add a new SLA Adjustment information in Neteye SLM module. This example implements the use case using the Tornado Script Executor invoked with a Jira/Jira Service Desk Webhook and as result, sending back via Jira/Jira Service Desk public rest/API a comment to the Ticket that triggered the action.
The SLM module should be installed on your NetEye system.
Here is my configuration in the Tornado GUI for my rule:
Constraint string:
{
  "type": "AND",
  "operators": [
    {
      "type": "equals",
      "first": "${event.type}",
      "second": "issue_sla_adjustment"
    }
  ]
}
Action string:
[
  {
    "id": "script",
    "payload": {
      "args": [
       "'${event.payload.mydata.issue.fields.customfield_10058}'",
       "'${event.payload.mydata.issue.fields.customfield_10008}'",
       "'${event.payload.mydata.issue.fields.customfield_10009}'",
        "'${event.payload.mydata.issue.fields.summary}'",
        "'${event.payload.mydata.issue.key}'",
      "'${event.payload.mydata.issue.fields.creator.displayName}'"
      ],
      "script": "/neteye/shared/share/scripts/setSlaCorrection.sh"
    }
  }
]
Tornado supports the ability to execute certain types of Actions. Currently those supported are listed here: https://github.com/WuerthPhoenix/tornado/tree/develop/executor In this test Example I use “Tornado Scripts Action” that permits the execution of a custom script as a result of event processing .
The action, as you can see, is invoked by the node “id” : “scripts”
Some details about the ARGS description:
- ${event.payload.mydata.issue.fields.customfield_10058}= hostname to adjust >> Textfield in Jira CustomField
- ${event.payload.mydata.issue.fields.customfield_10008} = start datetime adjustment >> DateTime Picker in Jira CustomField
- ${event.payload.mydata.issue.fields.customfield_10009} = end datetime adjustment >> DateTime Picker in Jira CustomField
- ${event.payload.mydata.issue.fields.summary} = ticket subject/summary
- ${event.payload.mydata.issue.key} = ticket key (you can use also ticket ID)
- ${event.payload.mydata.issue.creator.displayname} = Display name of author
- ${event.payload.mydata.issue.fields.xxxxx} = Event type (DOWN by default) << currently not used
Here is a simple bash file that can be used as script. (sorry for the date conversion mess, but this was the fastest way I’ve found to convert UTC to local time and respect the whole ISO 8061 date format)
#!/bin/sh

timeZone="Europe/Rome"
hostname=$1

#Parsing and converting Jira ISO 8061 date format - Quick and dirty!
from=$(date -d"TZ=\"${timeZone}\" $2")
bfrom=$(date -d "$from" "+%Y-%m-%d %H:%M:%S")

to=$(date -d"TZ=\"${timeZone}\" $3")
bto=$(date -d "$to" "+%Y-%m-%d %H:%M:%S")

description=$4
ticket=$5
author=$6
eventtype=$7

jirahost="https://[your-jira-instance].atlassian.net"
jirauser="[your-jira-user]"
jiraapitoken="[your-jira--user-api-token]"

output=$(sudo /usr/bin/icingacli slm adjustments create --host-name="$hostname" --description="$description" --start="$bfrom" --end="$bto")
comment="{\"body\": \"Event adjustment added:[$ticket]$description (By: $author - From: $from - To: $to\"}"

curl  --user $jirauser:$jiraapitoken -X POST  $jirahost/rest/api/2/issue/$ticket/comment  -H 'Content-type: application/json' -v --data "$comment"
Here is a test string you can execute from console.
/neteye/shared/share/scripts/setSlaCorrection.sh 'MyHostname' '2020-08-20T17:00:00.000+0200' '2020-08-20T19:00:00.000+0200' 'Set a new Downtime' 'ISD-59' 'AuthorName'Jira/Jira Service Desk Cloud Webhook configuration
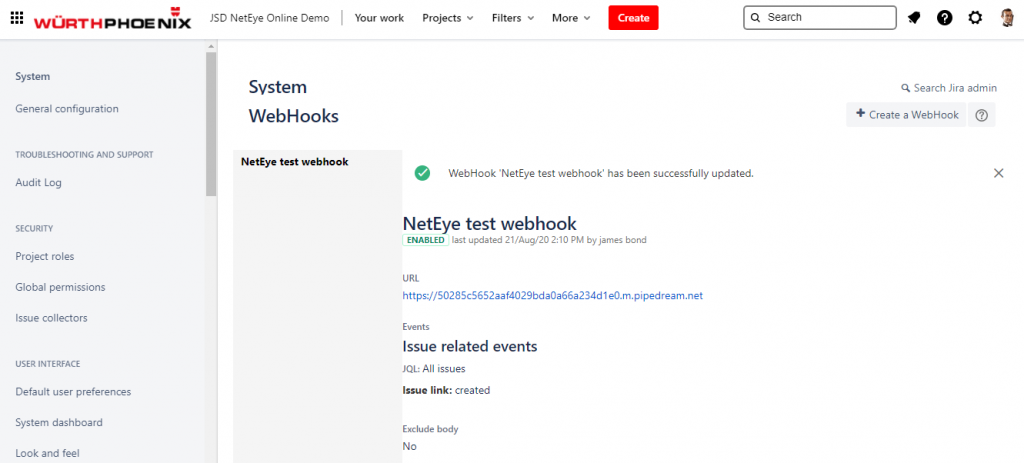
Activating a Webhook is simple and quick: just navigate to https:// https://<your-cloud-jsd-instance>/plugins/servlet/webhooks and provide the required information.
For this example you could configure the Webhook with this URL:
https://<your-neteye-with-valid-ssl>/tornado/webhook/event/anid?token=atoken
<your-neteye-with-valid-ssl>: Atlassian permits only WebHook invocation to specific ports and only if there is a valid SSL certficate. If you cannot respect this requirement you can use an online webhook test service to send the payload: i.e. https://requestbin.com/ Once you have the payload you can use the test tool in Tornado GUI:
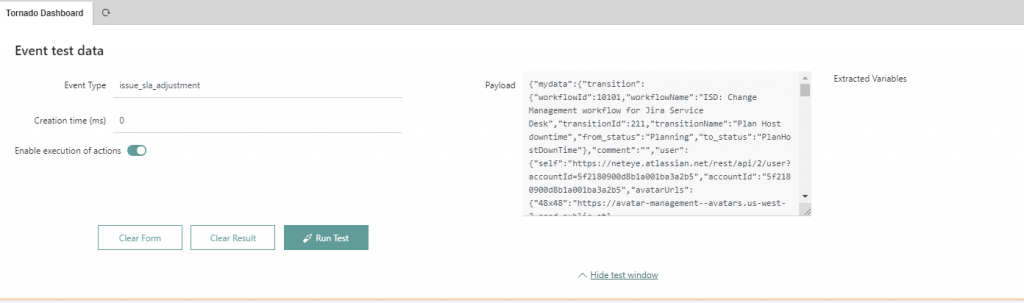
In order to use the test tool you should circle the payload with the node “mydata” because the rule will search inside this scope as defined in the webhook collector configuration at the beginning (“mydata”: “${@}“):
}
  "mydata":
      //your payload here
}
Create Jira/Jira Service Desk Cloud Custom Field
- Create the required fields as listed above
- In my test I added all the required fields on a workflow screen and I’ve invoked the Webhook trigger with a Workflow post-function.
- Create a ticket, fill the fields and if everything was correctly configured the payload will be generated and sent it to the target.
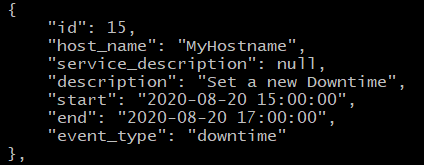
Result
SLA adjustment added in NetEye SLM:
Jira comment Added

USE CASE: SLA Adjustment in the SLM Module:
In a Jira/Jira Service Desk workflow step, in relation to a specific situation, the Ticket Assignee should have the ability to set a specific host in Downtime.
This example implements the use case using the Tornado Icinga2 Executor invoked with a Jira/Jira Service Desk Webhook
Here my configuration in Tornado GUI for my rule:
Constraint string:
{
  "WHERE": {
    "type": "AND",
    "operators": [
      {
        "type": "equals",
        "first": "${event.type}",
        "second": "plan_downtime"
      }
    ]
  },
  "WITH": {}
}
Action string
[
  {
    "id": "icinga2",
    "payload": {
      "icinga2_action_name": "schedule-downtime",
      "icinga2_action_payload": {
        "author": "${event.payload.mydata.user.displayName}",
        "comment": "${event.payload.mydata.issue.fields.summary}",
        "duration": 1000,
        "end_time": "${event.payload.mydata.issue.fields.customfield_10075}",
        "filter": "match(\"${event.payload.mydata.issue.fields.customfield_10073}\",host.name)",
        "pretty": true,
        "start_time": "${event.payload.mydata.issue.fields.customfield_10076}",
        "type": "Service"
      }
    }
  }
]
Some details about the ARGS description:.
- “${event.payload.mydata.issue.fields.customfield_10075}”: scriptrunner textfield scripted custom field (end epoch time)
- “${event.payload.mydata.issue.fields.customfield_10076}”: scriptrunner scripted custom fields (start epoch time)
To test Icinga2 API you could execute:
curl -k -s -u root:<api-pwd>-H 'Accept: application/json' -X POST 'https://localhost:5665/v1/actions/schedule-downtime' -d '{ "type": "Service", "filter" : "match("MyHostname",host.name)" , "start_time": 1597683600, "end_time": 1597701600, "duration": 1000, "author": "root", "comment": "TEST 9", "pretty" : true }' -v -k<api-pwd> can be found here: /neteye/shared/icinga2/conf/icinga2/conf.d/api-users.conf
Icinga API expects Epoch time. Currently in Tornado it is not yet possible to enrich data (a feature already on the roadmap!). For this reason I decided to convert the ISO 8061 using a trial version of Jira add-on Adaptavist Script Runner creating a Groovy Script Field to clone the converted datetime information in two new field with Epoch converted time.
import java.time.LocalDate
import java.time.LocalTime
import java.time.LocalDateTime
import java.time.Month
import java.time.ZonedDateTime
import java.time.ZoneId
import java.time.ZoneOffset
import java.util.Date

def mydatefieldname='mydate' // Add here your source datetime custom field name
def myepochfieldname='mytimestamp' // Add here your target epoch custom field name

def mydate = get("/rest/api/2/field")
        .asObject(List)
        .body
        .find { (it as Map).name == mydatefieldname }
        .id

def mytimestamp = get("/rest/api/2/field")
        .asObject(List)
        .body
        .find { (it as Map).name == myepochfieldname }

// get value
def mydatevalue = issue.fields[mydate]

// parse terrible ISO format
def strdate = new Date().parse("yyyy-MM-dd'T'HH:mm:ss.SSSZ", mydatevalue)
def stamp = strdate.time.toString()


// Update ticket with Timestamp value
def result = put("/rest/api/2/issue/"+issue.key)
        .header('Content-Type', 'application/json')
        .body([
            fields: [
                (mytimestamp.id): ""+stamp+""
            ]
        ])
        .asString()

 return ""+stamp+""
Result:
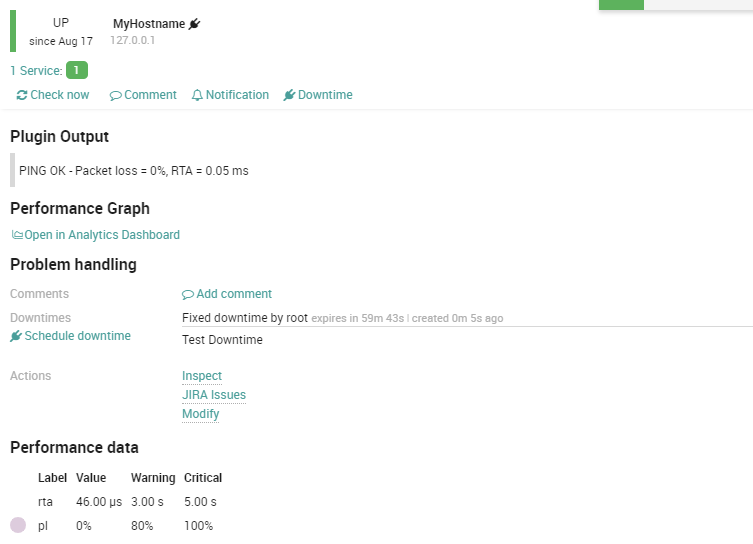
Now let’s go for another trial run!
More details about Tornado
If you want to understand more details you can check the official Tornado online documentation (https://github.com/WuerthPhoenix/tornado/tree/develop/tornado)


Nicola Degara
Technical Consulting and Delivery Team Manager at @ Würth Phoenix
My name is Nicola Degara and I work as Consulting and Delivery Team Leader. With a technical developer background, I am in the IT field since the nineties. After more than 6 years’ experience as director of an international software development company in Shanghai I have been embracing, once back to Europe, the dynamic NetEye experience and philosophy in combination with international Atlassian product projects.
My strong conviction towards the Open Source supports and continues to influence any reasons of my daily choices and future visions
Author
Latest posts by Nicola Degara
28. 10. 2020
Business Service Monitoring, Cloud, Icinga Web 2, NetEye, Service Management, SLM, Unified Monitoring
NetEye Incident Response with Atlassian Opsgenie Integration
19. 05. 2020
Anomaly Detection, Log Management, Machine Learning, NetEye, Unified Monitoring, Webinar
Neteye SIEM: processes and tools for IT Services Security 🇮🇹
24. 04. 2020
Events, NetEye, Unified Monitoring, Webinar
NetEye 4: novità nel monitoraggio unificato per l’infrastruttura IT 🇮🇹