


19. 12. 2025
NetEye

A frequent request I get is how to view the availability of hosts and/or services within a Grafana dashboard. Here I demonstrate how to do this for host availability.
To implement this, we first create a new table in our MariaDB on NetEye. I’ll call this table host_daily_sla and put it in the pre-existing reporting DB. You can decide to call it something else if you like and put it in its own DB at your discretion. Now for the next step we create an Icinga 2 report for host availability:
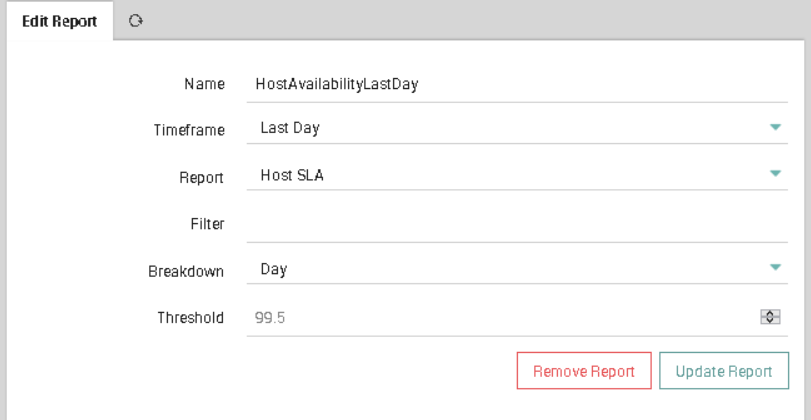
We need a Host Availability Report for the last day, and we have to schedule this report every day and save it as a CSV file in a directory on the NetEye Server to be able to process it with a script and load the data into our table we created above. I did that using NetEye Eventhandler and sent the Report to eventgw (the NetEye host will know what to do with this local user) and created an Email Rule which saves the attachment to /var/spool/neteye.
Now to our script. Here you only need to change the DB Parameters to adapt it to your system:
! /bin/sh
#
MYSQL Params
DBHOST=mariadb.neteyelocal
DB=reporting
DBUSER=myrouser
DBPASS=myropass
MYSQLCMD="mysql -BN -h $DBHOST -u $DBUSER -p$DBPASS $DB"

for i in $(ls -1 /var/spool/neteye/tmp/icinga_reporting_*.csv)
do
    FILE="$i"
    while read ll
    do
         if echo "$ll" | grep 'SLA in' >/dev/null
         then
                 continue
         fi
         host=$(echo "$ll" | cut -d, -f1)
         DATE=$(echo "$ll" | cut -d, -f2)
         sla=$(echo "$ll" | cut -d, -f3)
         if [ -z "$sla" -o "$sla" = "$DATE" ]
         then
                 echo "ERROR wrong file format!"
                 exit 1
         fi
         echo "INSERT INTO host_daily_sla (sladate,hostname,sla) VALUES ('$DATE','$host','$sla') ON DUPLICATE KEY UPDATE sla='$sla'" | $MYSQLCMD
    done < "$FILE"
    if [ -n "$ll" ]
    then
         host=$(echo "$ll" | cut -d, -f1)
         DATE=$(echo "$ll" | cut -d, -f2)
         sla=$(echo "$ll" | cut -d, -f3)
         if [ -z "$sla" -o "$sla" = "$DATE" ]
         then
                 echo "ERROR wrong file format!"
                 exit 1
         fi
         echo "INSERT INTO host_daily_sla (sladate,hostname,sla) VALUES ('$DATE','$host','$sla') ON DUPLICATE KEY UPDATE sla='$sla'" | $MYSQLCMD
    fi
    rm -f "$FILE"
done
You can also see that I save the Icinga 2 report with the prefix icinga_reporting_ to be able to load the right report, but you’ll need to take care of that yourself.
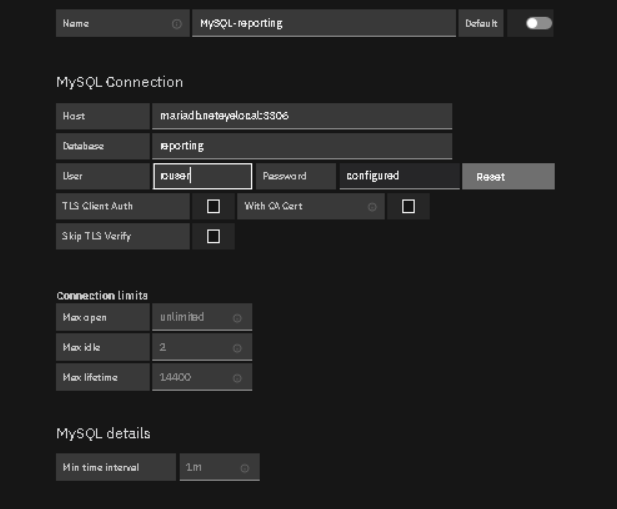
So now we have the data in the MariaDB table structured as 1 record x day x host. We can now make a new Datasource in Grafana to access that table:
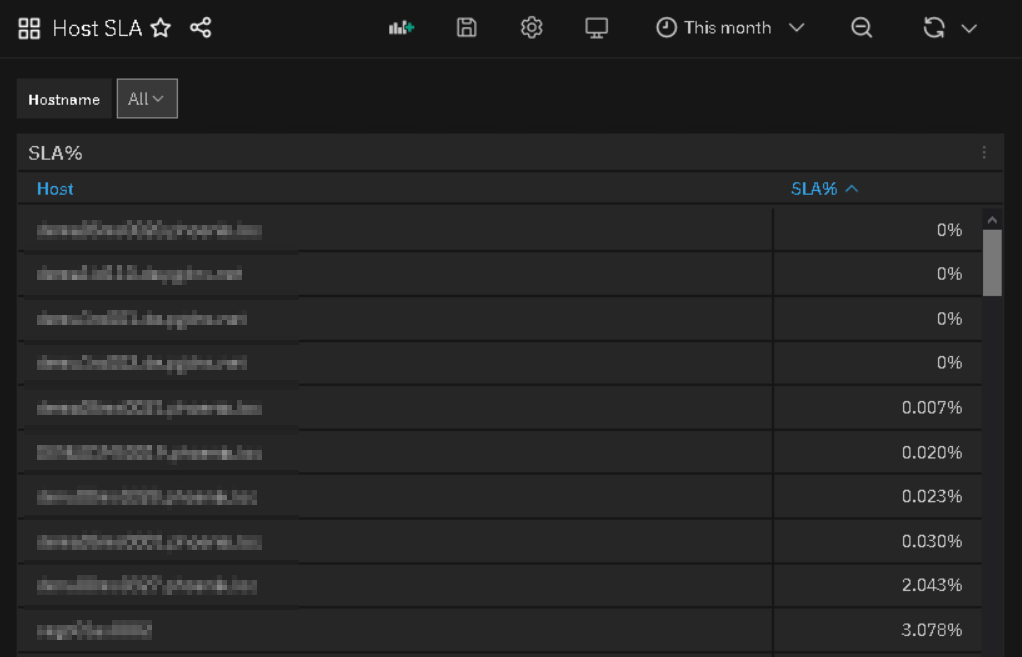
Next is the Dashboard. Here you can just create a table element and then use this query in it:
SELECT
  hostname,
  sum(sla)/count(*) as SLA
FROM host_daily_sla
WHERE
  hostname like $hostname AND
  sladate >= $__timeFrom() AND sladate <= $__timeTo() GROUP BY hostname order by hostname
After that you can also add a selection variable in Grafana for your host from the same DB using this query:
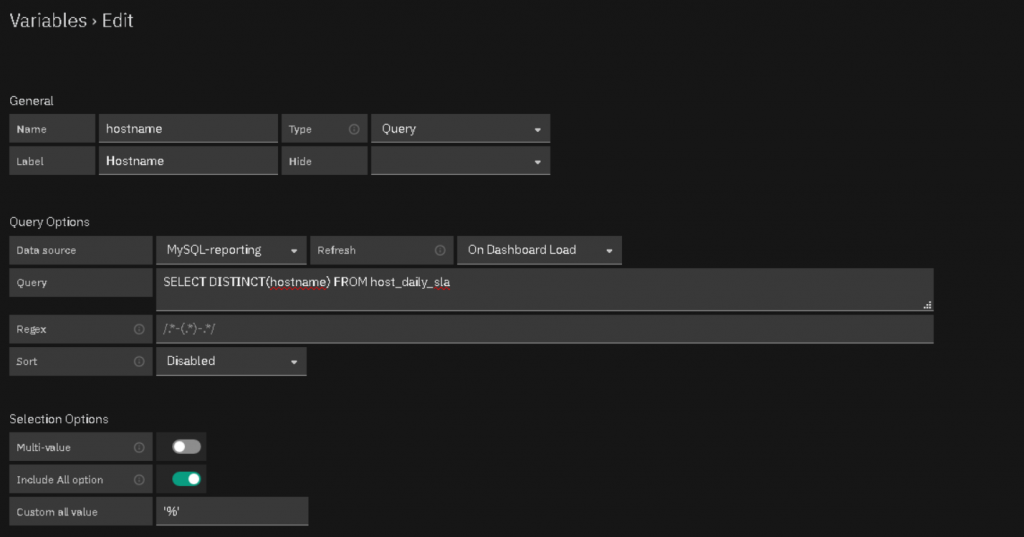
And finally enjoy your new Dashboard.

Juergen Vigna
NetEye Solution Architect at Würth IT Italy
I have over 20 years of experience in the IT branch. After first experiences in the field of software development for public transport companies, I finally decided to join the young and growing team of Würth Phoenix (now Würth IT Italy). Initially, I was responsible for the internal Linux/Unix infrastructure and the management of CVS software. Afterwards, my main challenge was to establish the meanwhile well-known IT System Management Solution WÜRTHPHOENIX NetEye. As a Product Manager I started building NetEye from scratch, analyzing existing open source models, extending and finally joining them into one single powerful solution. After that, my job turned into a passion: Constant developments, customer installations and support became a matter of personal. Today I use my knowledge as a NetEye Senior Consultant as well as NetEye Solution Architect at Würth Phoenix.
Author
Latest posts by Juergen Vigna
22. 05. 2025
NetEye, Unified Monitoring
Automatic Integration of NagVis Map into Icinga Web 2/NetEye Monitoring