30. 06. 2026
Azure, Cloud, Microsoft, NetEye, NetEye Extension Packs, Unified Monitoring

27. 03. 2023
Davide Sbetti
Anomaly Detection, ITOA, NetEye
A Simple Grafana Data Source for Outlier Detection (POC) – Part 1
In this article, I’d like to step through the development of a simple Proof of Concept (POC) Grafana data source with you where we retrieve data from an API, apply an outlier detection technique, and then visualize the end results in a dashboard. So… let’s begin!
Note: All the code discussed in this blog post (and in the one that will follow) is available, in its final version, in a GitHub repository. Moreover, the partial result obtained after this first blog post is available in a dedicated branch.
We need some data (so let’s generate it)
Okay, so our goal is to spot some outliers in a set of data. For this, we need to have some data that… will definitely contain some outliers! And since our goal is to focus more on outlier detection than on searching for a dedicated suitable dataset, we can generate the data ourselves to ensure it will respect our requirements.
In this case, we can build a simple web service in Python that will accept a time range as a parameter and generate a data point roughly every 15 minutes, with some of the data points being outliers. Because it’s a web service, we’ll then also be able to use this data generator as a source for the data of our Grafana data source.
Generating data with outliers
In particular, let’s use NumPy, one of the most-used Python packages for scientific computation, to generate the data with outliers. We’ll build a function that accepts as parameters the number of data points we’d like to have, their median value, the number of outliers, and then two error parameters: one that we’ll apply to regular data points and one for outliers.
The idea is to first generate the regular data points, starting from the specified median, and adding to it an error (negative or positive) taken randomly, for each data point, between 0 and the specified standard error parameter.
Similarly, we can then generate some lower outliers (below the median), subtracting the standard error, and some random negative errors that will be at a maximum the specified outlier error parameter. And we can apply the same approach for upper outliers (above the median), by just adding instead of subtracting.
The overall idea will then result in a function similar to this one:
"""
   Function used to generate data with lower and upper outliers
   Parameters:
      - median: the median value of the resulting data set
      - err: error bound (both positive and negative) that we
        would like to apply to normal data points
      - outlier_err: error bound for outlier data points
      - size: default size of our data set
      - outlier size: default number of outliers
"""
def generate(median=10, err=4, outlier_err=15, size=10,
             outlier_size=4):
   # Generate an array of negative and positive errors
   errs = err * np.random.rand(size) * np.random.choice((-1, 1), size)

   # Sum to the errors the median. These will be our
   # regular data points
   data = median + errs

   # Generate some lower outliers using the same approach.
   # First, generate some lower errors between 0 and 1
   # and multiply them with our outlier_err
   lower_errs = outlier_err * np.random.rand(outlier_size)

   # Then subtract the lower errors and
   # the standard one from the median
   lower_outliers = median - err - lower_errs

   # Generate some upper outliers using the same approach.
   # First, generate some upper errors between 0 and 1 and
   # multiply them with our outlier_err
   upper_errs = outlier_err * np.random.rand(outlier_size)

   # Then add the upper errors and the standard
   # ones to the median
   upper_outliers = median + err + upper_errs

   # concatenate and shuffle all the data we have generated
   data = np.concatenate((data, lower_outliers, upper_outliers))
   np.random.shuffle(data)

   return data
Exposing the generated data
Now that we’re able to generate the data with outliers, we’d like to expose them by creating some endpoints that we can use to get our data. For this, we’ll use Flask to create a simple web service to expose the generated data.
So let’s define a query endpoint that will only accept GET requests and as parameters the starting and ending time of the desired time range for which we’d like to get our data (the default will be the last six hours). We can then calculate how many data points we will generate, keeping in mind that one every 15 minutes is sufficient for our purposes, and then apply the function that we defined above to get them (with 5% of being outliers) and return them in JSON format.
@app.route("/query", methods=['GET'])
def query():
   # Compute default time range for query (last six hours)
   now_in_millis =  time.time() * 1000
   six_hours_ago = now_in_millis - 6*60*60*1000

   # Get query params
   from_millis = int(request.args.get('from', six_hours_ago))
   to_millis = int(request.args.get('to', now_in_millis))

   # How many points? one every 15 minutes (roughly)...
   data_points_time = [from_millis]

   # So find all the timestamp for which we
   # will generate the data
   while from_millis < to_millis:
      from_millis += quarter_hour_in_millis
      data_points_time.append(from_millis)

   data_points_time.append(to_millis)

   # Let's generate about 5% of outliers in our data points
   outlier_size = math.ceil(0.05 * len(data_points_time))

   # Generate data!
   data_points = generate(size = len(data_points_time) -
      2 * outlier_size, outlier_size = outlier_size)

   # Join the generated data points with the related timestamps
   data = np.column_stack((data_points_time, data_points))

   # Everything to JSON and send back
   response = jsonify({"query_response": data.tolist()})

   return response
As the final part of our data exposure, let’s also add a super simple handler for the requests to the root web path. This can also help us check later if our Grafana data source can connect to our simple web service.
@app.route("/", methods=['GET'])
def main():
   return "Your data source is working"
Now we’re ready to start our simple web server and concentrate on the Grafana side of our work. If you’re following along in our development using the associated GitHub repository, you can find the full code of the web server in the server/app.py file, along with a requirement file to install the dependencies. I strongly recommend that you install the Python dependencies in a virtual environment. To start our simple web service, you can execute the flask run command in the server folder.
To test the functionality of the web service, we can execute the following CURL command: curl http://localhost:5000/query. The result should resemble the following JSON response:
{
  "query_response": [
    [
      1679227445791.0,
      12.67632819966685
    ],
    [
      1679228345791.0,
      10.986287392407654
    ],
    [
      1679229245791.0,
      23.384986972575447
    ],
    ...
    [
      1679249045791.0,
      11.655500599477111
    ]
  ]
}
A Grafana data source plugin
Now let’s move to the Grafana side. Our goal, for now, is to create a data source plugin that can read the data exposed by our simple web service. In the next post, we’ll then add the outlier detection part.
We can follow the official Grafana documentation to create the basic structure of a data source plugin. We’ll then execute the npm create @grafana/plugin command to create a data source plugin without a backend since in our case it won’t be necessary.
The data source configuration
Once we create the basic structure with the create plugin, we can proceed to customize the configuration panel of the data source to let the user specify the URL of the web service (normally this will be http://localhost:5000). To do this, let’s modify the src/types.ts file, removing the MySecureJsonData structure since we won’t need to store any credentials. We can then modify the MyDataSourceOptions interface to store the web server URL as follows:
/**
 * These are options configured for each DataSource instance
 */
export interface MyDataSourceOptions extends DataSourceJsonData {
  webserver_url: string;
}
After that, let’s devote our attention to the file components/ConfigEditor.tsx. This represents the configuration form the user will see when adding the data source. Here, we can modify the visual part of a form with a single field for our web server URL. Moreover, we can connect the change event on the field with a small function that stores the result inside the properties of our data source, namely the ones we defined above. The resulting snippet of the changed ConfigEditor will then be as follows:
onWebserverURLChange = (event: ChangeEvent<HTMLInputElement>) => {
    const { onOptionsChange, options } = this.props;
    const jsonData = {
      ...options.jsonData,
      webserver_url: event.target.value,
    };
    onOptionsChange({ ...options, jsonData });
  };

  render() {
    const { options } = this.props;
    const { jsonData } = options;

    return (
        <div className="gf-form-group">
          <div className="gf-form">
            <FormField
                label="Webserver URL"
                labelWidth={15}
                inputWidth={20}
                onChange={this.onWebserverURLChange}
                value={jsonData.webserver_url || ''}
                placeholder="The URL of your webserver"
                required={true}
            />
          </div>
        </div>
    );
  }
Making the correct requests
After having enabled the user to specify the web service URL, we can implement the query function that, for now, will simply call the query endpoint with the chosen timeframe and return the exposed data to Grafana. To do this, let’s modify the src/datasource.ts file, which contains the data source code. First of all, we can modify the constructor of the class to retrieve the configuration specified by the user:
webserverURL: string;

  constructor(instanceSettings: DataSourceInstanceSettings<MyDataSourceOptions>) {
    super(instanceSettings);

    this.webserverURL = instanceSettings.jsonData.webserver_url;
  }
Then we can modify the function that performs the query to map each request made by Grafana to a request to our web service. Each answer is mapped to a Data Frame with two columns: time and value. To perform each request we’ll use a helper function that will pass along the request using the URL specified by the user in the configuration, pointing to the /query endpoint and passing as a parameter the range specified by the user.
async query(options: DataQueryRequest<MyQuery>): Promise<DataQueryResponse> {
    // Extract the time range
    const {range} = options;
    const from = range!.from.valueOf();
    const to = range!.to.valueOf();

    // Map each query to a requests
    const promises = options.targets.map((query) =>
        this.doRequest(query, from, to).then((response) => {
          // Create result data frame
          const frame = new MutableDataFrame({
            refId: query.refId,
            fields: [
              {name: "Time", type: FieldType.time},
              {name: "Value", type: FieldType.number},
            ],
          });
          // for each element of the query response add a row in the result data frame
          response.data.query_response.forEach((point: any) => {
            frame.appendRow([point[0], point[1]]);
          });
          return frame;
        })
    );
    return Promise.all(promises).then((data) => ({ data }));
  }

  async doRequest(query: MyQuery, from: number, to: number) {
    // Create the request params
    const request_params = {
      method: "GET",
      url: this.webserverURL + "/query",
      params: {"from": from, "to": to},
    };
    // Perform the request
    const result = await getBackendSrv().datasourceRequest(request_params);

    return result;
  }
Moreover, we can also slightly modify the function used to test the data source (from the configuration panel), to use the main endpoint we added previously to ensure the connection to the web service works:
async testDatasource() {

    const request_params = {
      method: "GET",
      url: this.webserverURL,
    };
    const result = await getBackendSrv().datasourceRequest(request_params)

    let status = "failed";
    let message = "";

    if (result.ok) {
      status = "success";
      message = result.data;
    }

    return {
      status: status,
      message: message,
    };
  }
Testing that everything works
Now that we have a draft of our data source plugin, we can deploy our data source to our local Grafana installation. The build_and_apply.sh script, available in the repository, can help us with this. This will install the dependencies using yarn install, build the front end using yarn build, and copy the resulting files in the standard path for Grafana plugins, namely /var/lib/grafana/plugins/. Please note that, since the plugin is not signed, it needs to be added in the list of allowed unsigned plugins in the grafana.ini files, as also explained in the official documentation. After that, a restart of the Grafana Server service is needed.
When the data source is correctly loaded by Grafana, we can create a Data Source inside Grafana itself that points to our local web service.
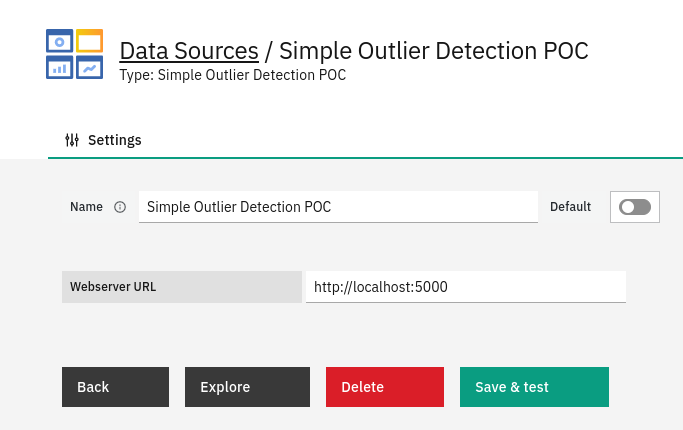
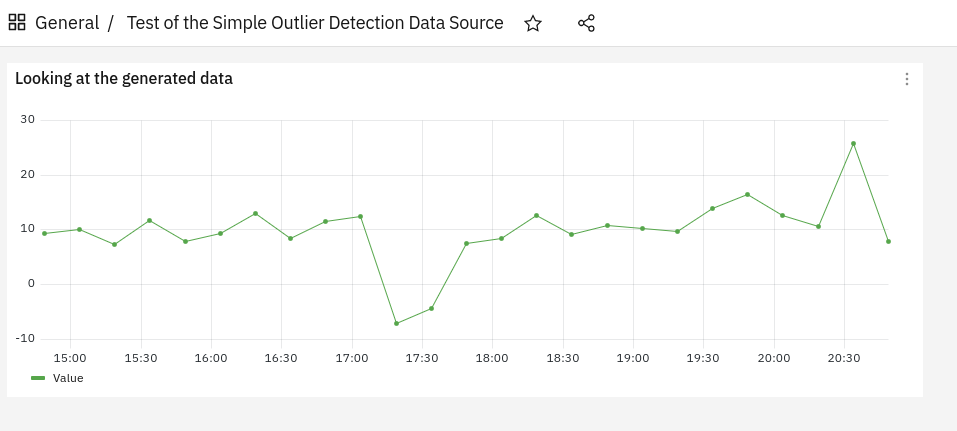
We can click on Save & test to ensure the connection to our web service works, and then to fully test the retrieval of the exposed data we can create a dashboard pointing to the data source we just created, where our generated data will be plotted! Can you spot the outliers?
Partial conclusions
In this article, we saw how we can generate and expose data containing some outliers, using Python.
Moreover, we created a simple data source that allows us to specify the target URL of our web service and queries then the created endpoint to retrieve the exposed data and return them to Grafana.
What we’ll look at next time
It’s true. So far no outlier detection yet. But we first had to lay the groundwork for that, so please forgive me for this. In the next blog post which will follow shortly, we’ll modify the query function a bit to also perform some simple outlier detection on the retrieved data, before returning them to Grafana.
Want a hint? Well, I’d suggest reading up on “isolation forests”. Stay tuned for that!
These Solutions are Engineered by Humans
Are you passionate about performance metrics or other modern IT challenges? Do you have the experience to drive solutions like the one above? Our customers often present us with problems that need customized solutions. In fact, we’re currently hiring for roles just like this as well as other roles here at Würth Phoenix.
Davide Sbetti
Hi! I'm Davide and I'm a Software Developer with the R&D Team in the "IT System & Service Management Solutions" group here at Würth IT Italy. IT has been a passion for me ever since I was a child, and so the direction of my studies was...never in any doubt! Lately, my interests have focused in particular on data science techniques and the training of machine learning models.
Author
Latest posts by Davide Sbetti
30. 06. 2026
AI, Kubernetes
Load-balancing Requests to LLMs in Kubernetes: A KV-cache Approach with llm-d!
30. 03. 2026
APM, Log Management, Log-SIEM, NetEye
Sending OTel Data to Elasticsearch: Tenant Segregation through OAuth