27. 06. 2026
Log Management, NetEye

25. 03. 2026
Guglielmo Fortuni
Atlassian, NetEye, Unified Monitoring
Jira Operations Tips & Tricks for NetEye Users – Part 1
Practical lessons learned from real-world alert routing, automation, and integrations
Introduction
As more teams and customers rely on NetEye as their primary monitoring stack, Jira Operations (Jira Ops) may become a central component for alert routing, on‑call scheduling, and automated incident creation.
But Jira Ops is not always intuitive: routing rules might behave differently than expected, warning notifications create noise, automations become tricky, and alert behaviors are not always obvious.
After a dive deep into Jira Ops integration with NetEye – deep enough to earn myself a couple of headaches – I put together a collection of hands‑on tips and tricks that helped me build a clean, predictable, (almost) noise‑free alerting workflow.
How Jira Operations + Neteye Works (A Quick Overview)
Before getting into the tips and tricks, let me briefly summarize what Jira Ops does and how the NetEye (Icinga) integration works.
Jira Ops handles notifications and events from various sources and transforms them into alerts. These alerts can be filtered and routed to the intended teams or users, notifying them via Jira mobile app, MS Teams, SMS, phone call, email, and other methods. It provides a single point to configure escalation, schedule, on-call rotation, and related settings without configuring each source or monitoring software separately.
On the NetEye side, we use an Icinga notification script sendtojsm (configurable via NEP) that forwards notification data to Jira Ops using an API key.
Reference:
NEP packages (nep-notification-opsgenie)
Neteye User Guide – NEP Packages
Bitbucket – NEP Notification Opsgenie
Whenever Icinga triggers a notification, this script sends all relevant information to Jira Ops.
On the Jira Ops side we must configure the Icinga integration within Jira Ops itself, so it can properly receive and parse notifications coming from NetEye/Icinga.
This is what enables Jira Ops to recognize the incoming payload, create an alert, and map fields (such as affected service, host, state, tags, timestamps, etc.) into the Jira Ops alert structure.
Reference:
Atlassian – Integrate With Icinga2
Once Jira Ops receives the notification, it automatically creates an alert, which then flows through:
– Routing rules
– Escalation policies
– On‑call schedules
…until it reaches the correct destination team or user.
In the opposite direction, we have the Jira Edge Connector (JEC) running on the NetEye host. JEC receives actions coming from Jira Ops (e.g., acknowledge, comment, downtime) and applies them to the corresponding Icinga host or service.
Reference:
Install Jira Edge Connector
Thanks to this two‑way flow, you can acknowledge or comment on an Icinga service directly from your smartphone using the Jira mobile app – which, by the way, is our tip/trick.
With this overview in mind, let’s jump into the suggestions.
1. Closing Alerts on Warning Notification (Instead of Creating Them)
In many NetEye setups, Icinga sends notifications for every state change:
– OK
– WARNING
– CRITICAL
– UNKNOWN
However, depending on the use case (e.g. 24×7 monitoring), you may want that warning states should not generate an alert.
Then you might think: “Well, then just don’t send WARNING notifications!”
And… unfortunately, it’s not that simple.
Let’s look at this real‑world state transition example, using no-warning-notification:
OK → WARNING (no notification) → CRITICAL (notification!) → WARNING (no notification) -> stays in WARNING ….
In this scenario, the object ends up stuck in a WARNING state. It did generate a CRITICAL alert earlier, which is still open, but now that the service is only in WARNING, I don’t want to keep that alert open, and I definitely don’t want to be notified anymore.
This is exactly the problem: If WARNING transitions don’t send notifications, Jira Ops has no signal that tells it to close the previously created alert. So you end up with an alert lingering in an uncritical state – noisy, misleading, and not representative of the real situation.
So I implemented the following solution:
✅ Treat WARNING notifications as “close events” instead of “create events”
In the Jira Ops integration rules, my WARNING events for this specific use case do not open alerts. Instead, they:
- Match the existing alert for that service
- Close it automatically
This eliminates “sticky warning” alerts completely and keeps the alert list clean. It also avoids confusing (and waking up) 24×7 operators who would otherwise see an alert stuck forever in WARNING after the critical phase is over.
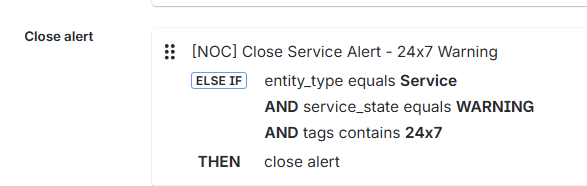
Here is an example of an alert rule that works like this :
2. Enhancing Jira Ops Alerts: Tags and HTML Formatting
Jira Ops works much better when alerts include useful contextual metadata and are formatted in a way that makes them easy to understand at a glance.
➡️ Adding tags
In the sendtojsm script, you can easily set the tag parameter. I use it to pass custom info directly from Icinga, for example:
- Customer code
- Impacted service category
- SLA class (e.g., 8×5, 24×7)
- Environment type
- Service group
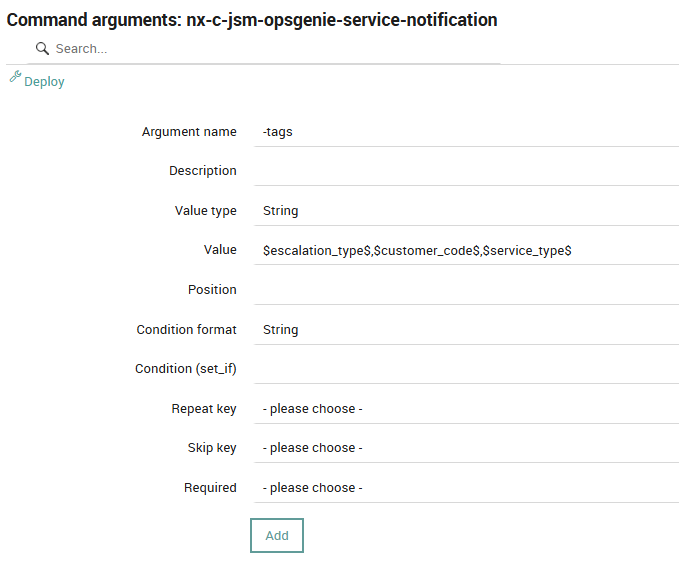
Here’s an example of how the notification plugin script is executed:
/neteye/shared/icinga2/conf/icinga2/scripts/send2jsm -apiKey <MY_API_KEY> -hdn <HOSTDISPLAYNAME> -hn <HOSTNAME> -entityType host -t NOTIFICATIONTYPE .... -tags <MY_TAGS>
The tags parameter expects a comma‑separated list. For example:
-tags '$escalation_type$ , $customer_code$ , $service_type$'
I intentionally wrote the examples using Icinga variable formatting to highlight how these values are configured inside an Icinga notification command. As usual, you can define an argument and pass any custom variable you need.
If required, you can also reference host or service variables using the standard Icinga syntax, such as service.vars.custom_var_name or host.vars.custom_var_name.
Here’s an example of the command argument configuration:
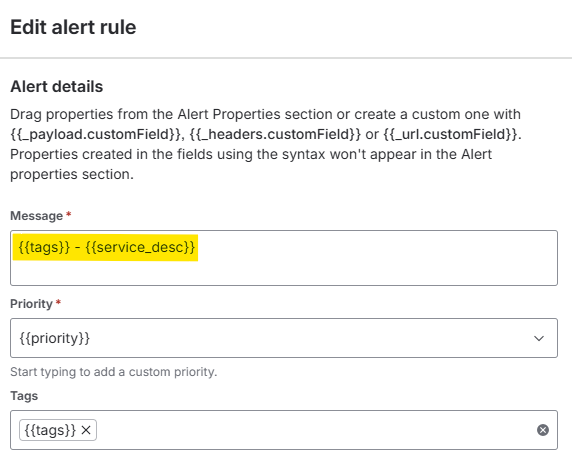
On the Jira Ops side, you can use tags to filter alerts (later we will see an example) and even to make the alert more readable. You can also embed tags directly into the alert message using the alert creation rule configuration:
These tags later become essential for:
- Routing rules
- Filtering views
- Triggering automations
- Reducing alert noise
- Identifying SLA-specific escalation paths
In my experience, well‑designed tag structures are the foundation of a predictable and maintainable Jira Ops setup.
🔗 HTML Formatting
Besides tags, another useful way to enhance your alerts is to make them more user‑friendly by formatting them with HTML. This can be configured inside the alert creation rule, in the description field.
By correctly combining HTML with alert properties, you can fully customize the alert message to fit your operational needs. Here’s an example of the HTML configuration:
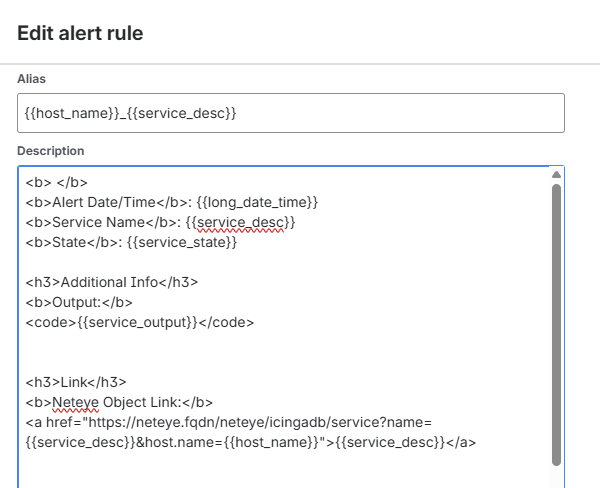
<b> </b>
<b>Alert Date/Time</b>: {{long_date_time}}
<b>Service Name</b>: {{service_desc}}
<b>State</b>: {{service_state}}

<h3>Additional Info</h3>
<b>Output:</b>
<code>{{service_output}}</code>


<h3>Link</h3>
<b>Neteye Object Link:</b>
<a href="https://neteye.fqdn/neteye/icingadb/service?name={{service_desc}}&host.name={{host_name}}">{{host_name}} : {{service_desc}}</a>


<b>Alert management Procedure:</b>
<a href="https://myatlassianinstance.atlassian.net/wiki/spaces/pages/MyProcedure">Confluence - Procedure</a>
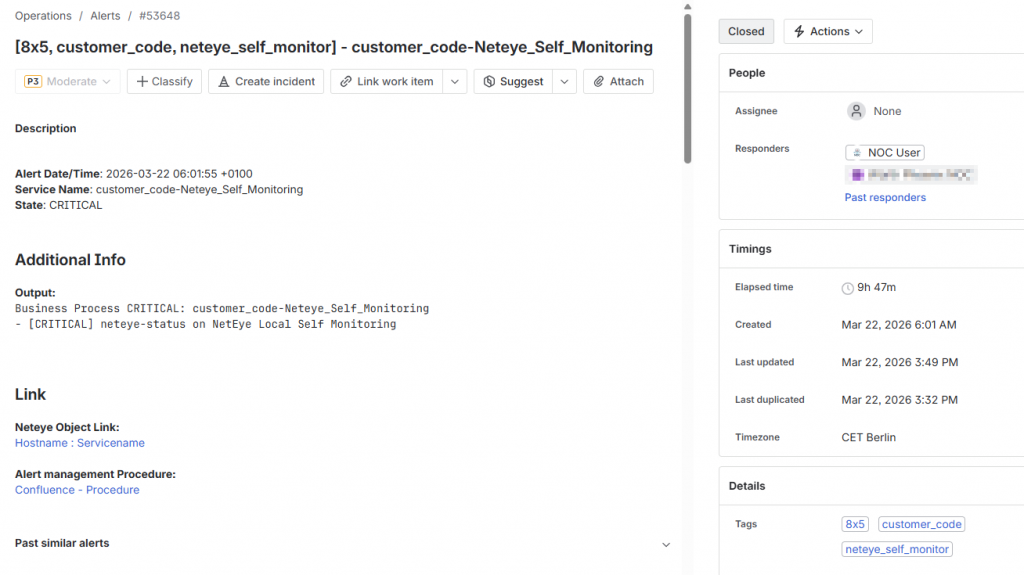
✅ Final result
Here’s an example of an alert formatted with tags (the ones in square brackets) and HTML styling. As you can see, an alert becomes much more useful when its content is immediately readable.
A clear structure, contextual information, and links directly to NetEye objects greatly simplify troubleshooting – allowing operators to jump straight to the right monitoring object without searching manually.
In the next post, we’ll explore how to modify the send2jsm script to make it even more customizable and pass any additional parameter from Icinga to Jira Ops.
3. Filtering Alerts Based on Count (Show it Only After N Repetitions)
Some alerts should not appear immediately in the operator dashboard – for example flapping services or low‑priority checks.
To avoid unnecessary complexity inside the Icinga configuration (yes, we can configure notification delays, but we also know the frustration of trying to perfectly tune Icinga notifications to precisely match every desired object…), I decided to shift this logic to Jira Ops by creating a custom filter.
I implemented a Jira Ops alert filter that displays certain alerts only when count > N , which is equivalent to displaying certain alerts only after some time, depending on the Icinga notification interval.
You can clearly see how tags become extremely useful for organizing and filtering alerts effectively. Here’s an example of the filter I used:
responders: <My Team> AND
( tags: 8x5
  AND (status: "open" OR status: "acknowledged" OR status: "snoozed")
  AND NOT tag : 8x5_low_priority)
OR
( tags: 8x5_low_priority
  AND (status: "open" OR status: "acknowledged" OR status: "snoozed")
  AND count > 3
)
What this achieves:
- Standard 8×5 alerts appear immediately
- Low priority alerts only appear after 3 occurrences → helps reduce noise
- Operators see alerts only when they matter
This can be useful to fight alert fatigue and prevent dashboard pollution.
Conclusions
That’s all for this first part of my Jira Ops Tips & Tricks.
In the next post, we’ll dive into additional insights – spoiler alert: Understanding Alert Fatigue, Precise Routing Rules, and Further Alert Enrichment.
I’ll also dedicate a separate post to how I automated ticket creation and customer notification workflows based on incoming alerts.
Stay tuned!
These Solutions are Engineered by Humans
Did you find this article interesting? Does it match your skill set? Programming is at the heart of how we develop customized solutions. In fact, we’re currently hiring for roles just like this and others here at Würth IT Italy.
Guglielmo Fortuni
Hello! I'm Guglielmo, a NOC Engineer within the Service & Support / NOC Team at Würth IT Italy. I specialize in customer support and in the management and monitoring of our MSP monitoring platform, NetEye Cloud. My daily work is focused on ensuring service continuity, optimizing alerting workflows, and improving monitoring efficiency for our customers.