
15. 12. 2015
Patrick Zambelli
Asset Management, Downloads / Release Notes, Events, Log Management, NetEye, Real User Experience, Unified Monitoring
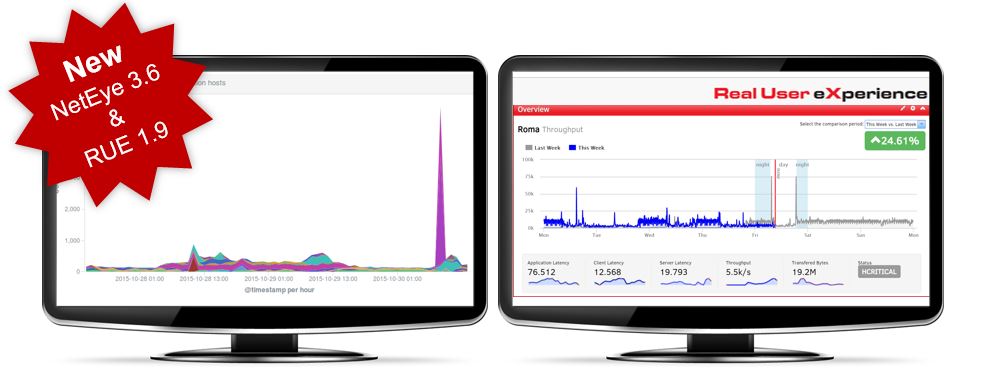
NetEye 3.6 and RUE 1.9 Have Been Released!
Effective log auditing, meaningful reports and better integration of the single modules
The new version NetEye 3.6 provides some substantial improvements, to respond to specific customer needs, as well as to satisfy the continuously growing requirements in the complex world of IT monitoring.
Major investments were made in the fields of reporting and SLA measurement. Thanks to a unified data structure, the merge of decentral collected data in a single reporting database is now possible.
Get an overview about the latest developments:
- Data becomes information: log analysis and event correlation with the new log management module
- More precise reporting: event correction to better monitor SLAs
- Better integration: data exchange among modules
- End user experience: continuous monitoring of the application performance from the end user’s perspective with Alyvix 2
- Real user experience: release of RUE 1.9
- Configuration validation and recovery
- Illustration of changes on the baseline
- Individual definition of comparative periods
- Detailed analysis through the definition of individual filters
- New configuration panel for the network probe of ntop
- First machine learning functionalities
Get more details from the actual NetEye 3.6 and RUE 1.9 Release Notes.
We are proud that NetEye, through continuous developments, based on results of yearly customer surveys, user groups and trends in the open source community, reached the state of a unified monitoring solution, which is able to respond customer requirements also in an enterprise environment.


Patrick Zambelli
Project Manager at Würth IT Italy
After my graduation in Applied Computer Science at the Free University of Bolzano I decided to start my professional career outside the province. With a bit of good timing and good luck I went into the booming IT-Dept. of Geox in the shoe district of Montebelluna, where I realized how a big IT infrastructure has to grow and adapt to quickly changing requirements. During this experience I had also the nice possibility to travel the world, while setting up the various production and retail areas of this company. Arrived at Würth Phoenix (now Würth IT Italy) I started developing on our monitoring solution NetEye. Today, in my position as Consulting an Project Manager I am continuously heading to implement our solutions to meet the expectation of your enterprise customers.
Author
Latest posts by Patrick Zambelli
16. 01. 2024
NetEye, Unified Monitoring
Icinga 2 DSL for Defining the Monitoring Status of Objects with Director
23. 12. 2020
NetEye
Tornado – Getting in Action with Sample Rules
05. 05. 2020
NetEye, Unified Monitoring
Import Data Correlation and Automation with Icinga2 Director