
20. 06. 2017
Susanne Greiner
Anomaly Detection, NetEye, Real User Experience, Unified Monitoring
Next Level Performance Monitoring – Part I
Network traffic keeps becoming more and more heterogeneous. In many cases, it is not enough to monitor a system as we have done in the past. Here I will present the key ingredients according to Würth Phoenix for successful state of the art performance monitoring and proactive analysis of those applications that are critical for your business.
Combining User Experience and Performance Metrics for new Insights
User experience is a very important factor. If your measurements seem in the right range, BUT end users complain about slow applications, you need to act. For this reason, user experience combined with an overview of all the servers being put under monitoring is the right place to start. In our opinion it is of vital importance to know when critical business applications begin to slow down before your users start to complain. You can achieve this by running continuous checks via Alyvix – our active user experience monitoring solution. Test cases can be written specifically for the most vital parts of your applications, and the functionality and speed of those very parts can be checked as often as needed. The outcome in terms of performance of each individual user interaction tested is then saved into the same central time series data base as the performance metrics registered from all original sources of interest (such as Perfmon data, ESX performance data, etc.) It is then possible to perform a multiserver zoom and with a single click to navigate to the most interesting servers during time periods where Alyvix detected problems.
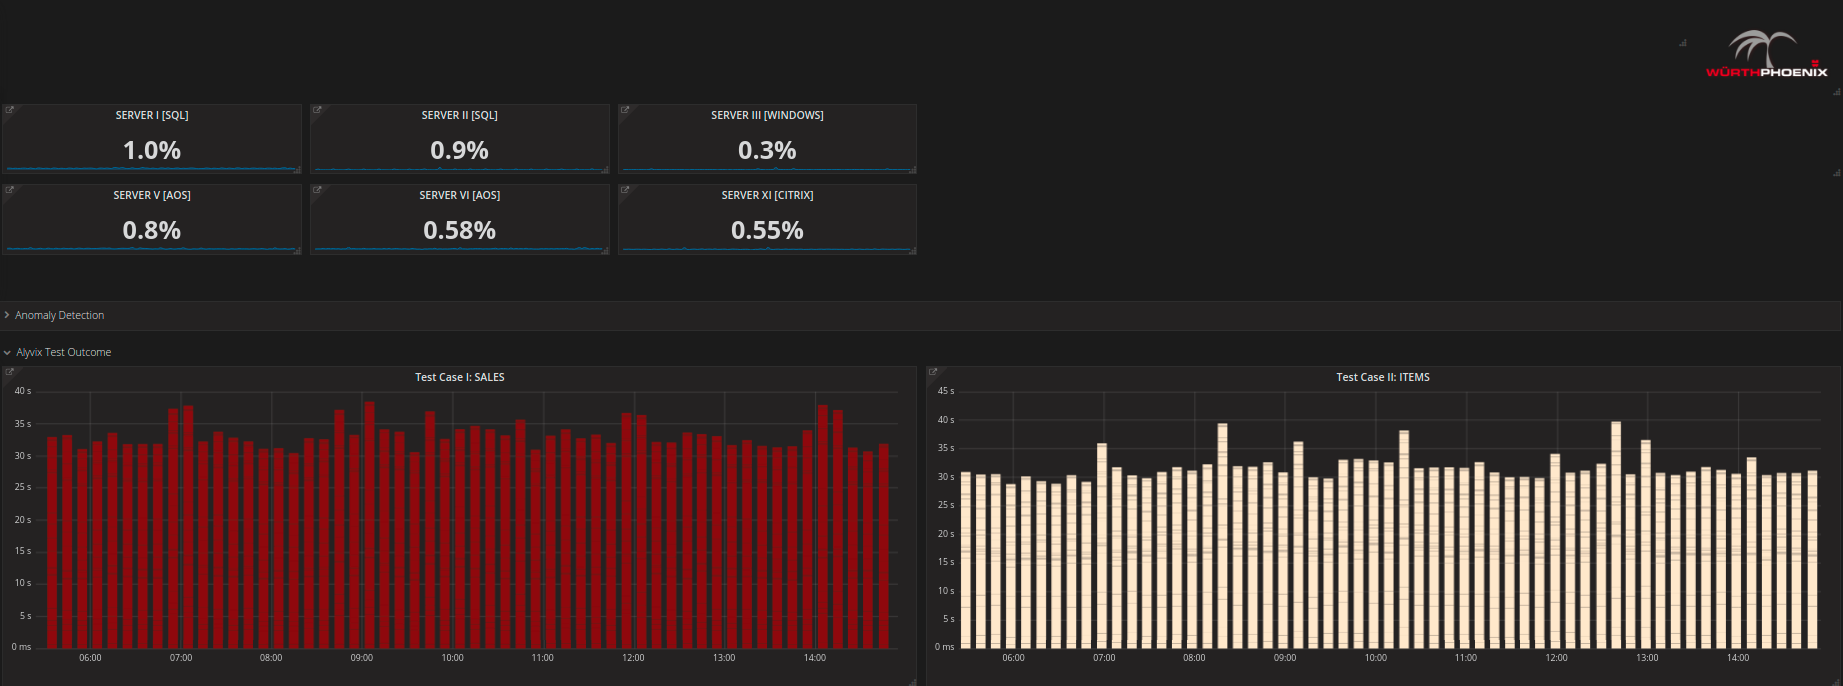
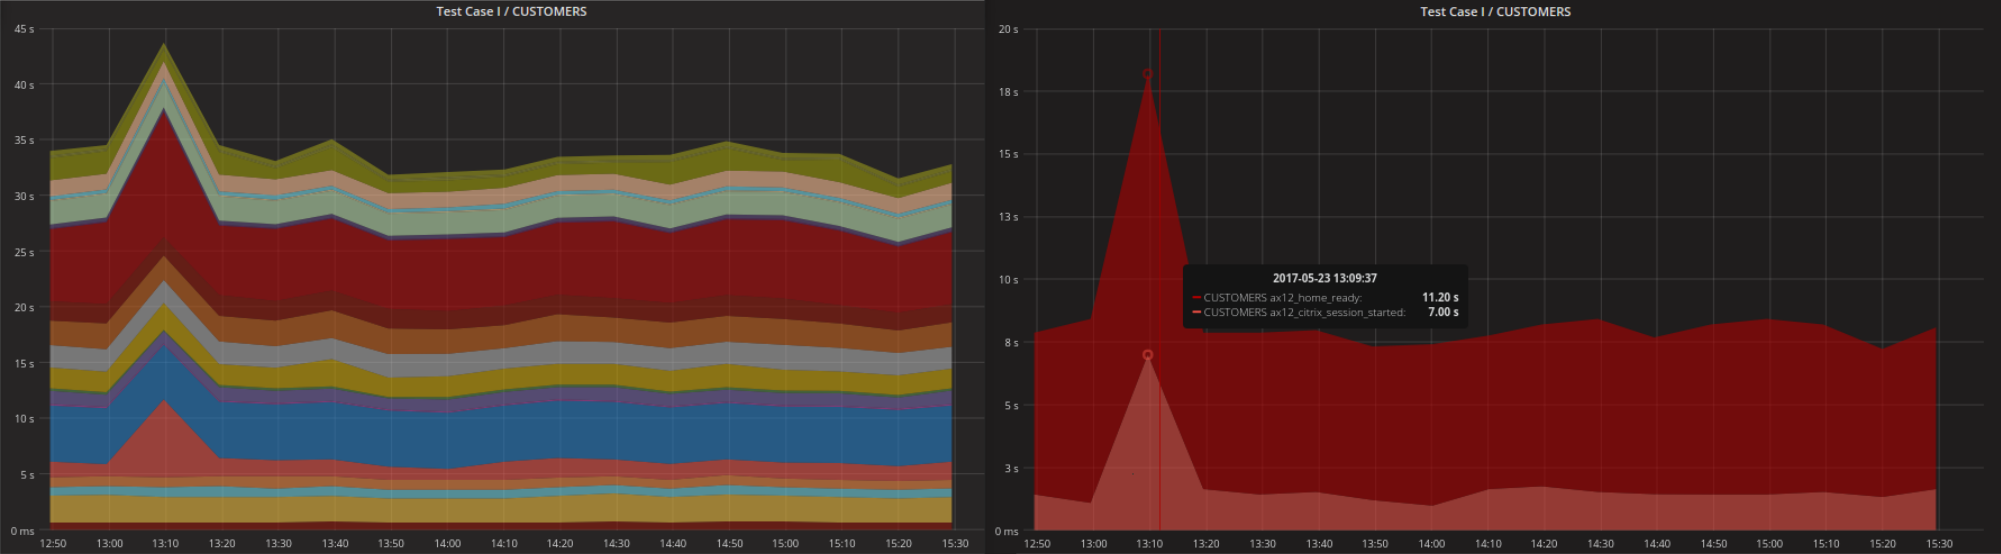
From the main dashboard you can access a more detailed View of the Alyvix tests where it becomes easy to detect whether longer test durations are due to a single transaction or else to a set of transactions within the test. Basically you can then know exactly which part of your business critical application is currently experiencing a slow down
In addition, you can navigate to a more homogeneous view of all the available performance metrics for each server by clicking on the server name as described in the next section.
Creating a homogeneous view of metrics from multiple sources
The second key ingredient of our Würth Phoenix next level performance monitoring solution is the homogeneous view of all available performance metrics from each server monitored. Navigate between SQL, AOS, CITRIX and other servers on your system and you will always find their most relevant performance metrics represented in a homogeneous way. You don’t need to worry about where they come from and how to compare them: simply begin interpreting your network performance.
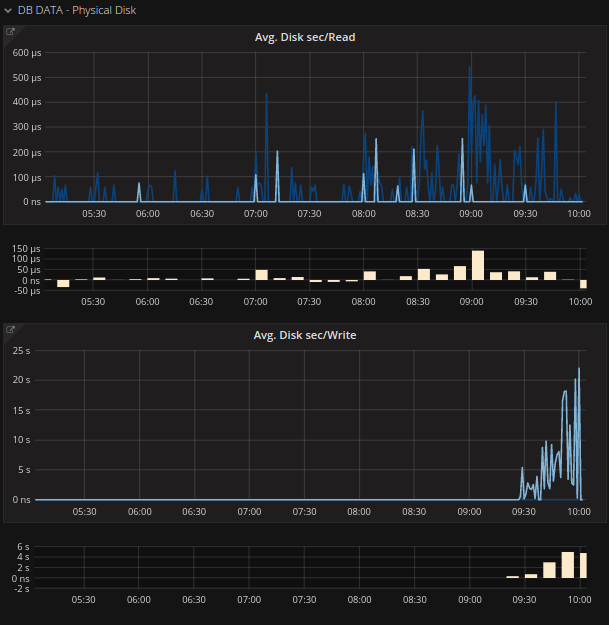
The homogeneous view makes it possible to follow events on your system in real time. You will be more aware of changes in the system, you can quickly scan all performance metrics via the multimeasure zoom, and have the possibility of easily comparing traditional metrics with co-occurring disk operations.
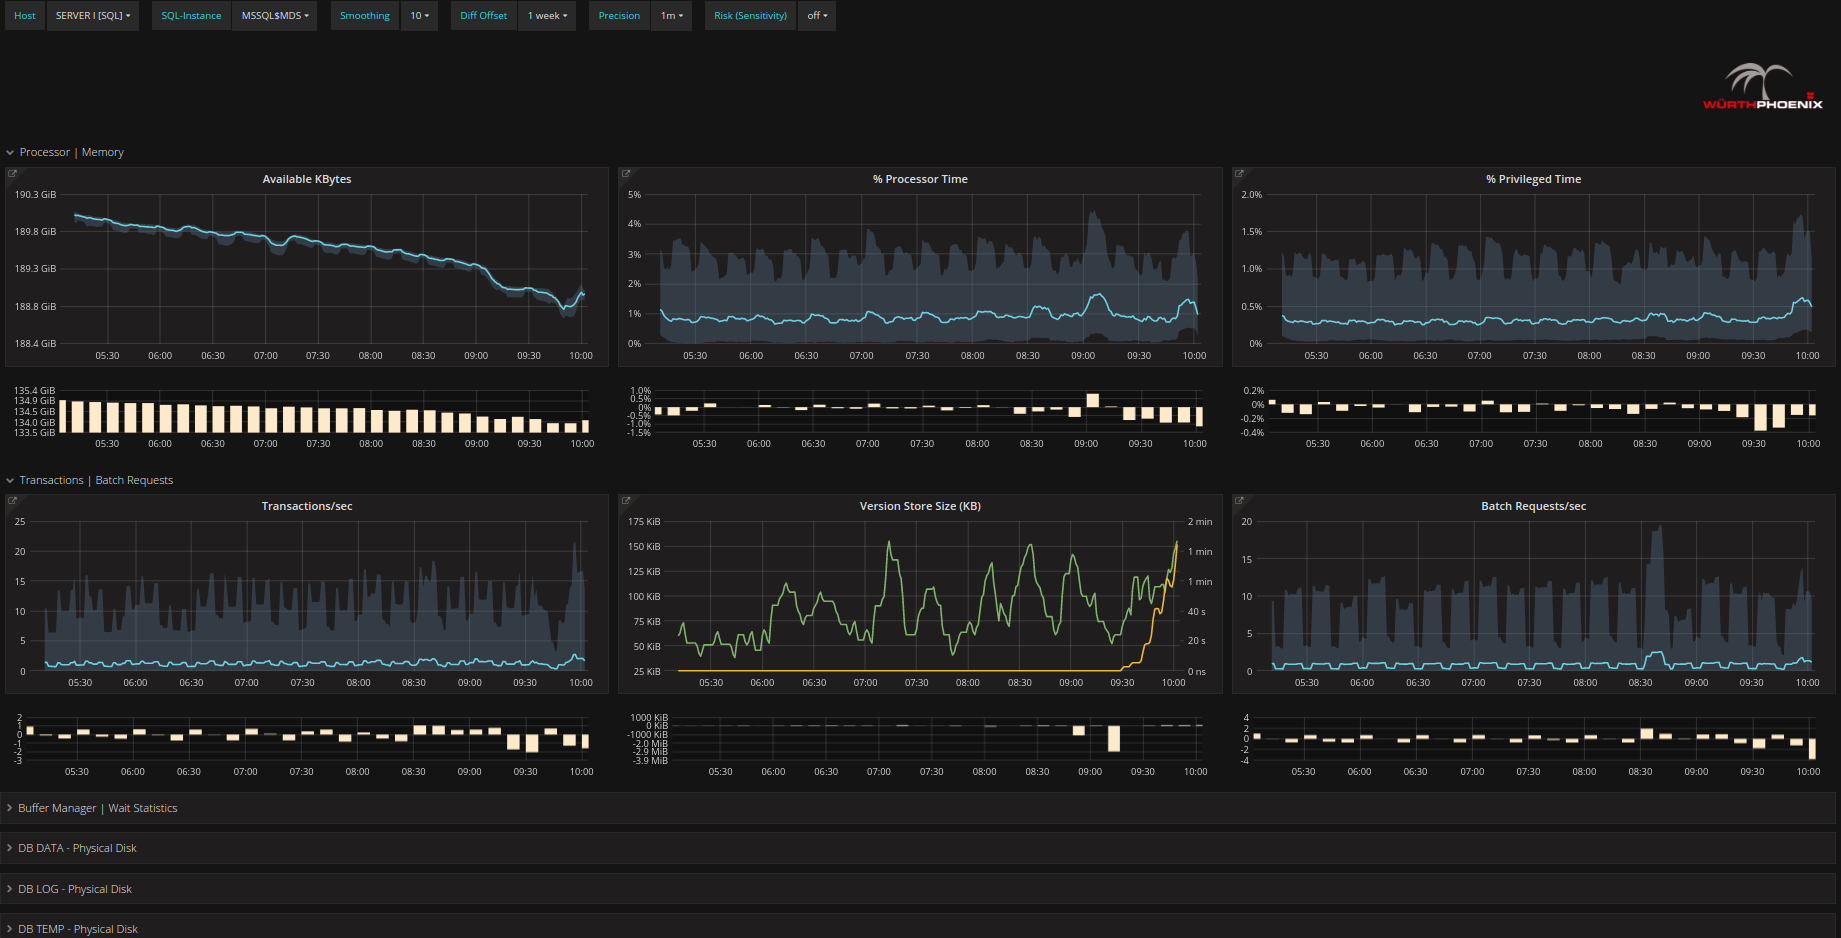
Make Performance Metrics more transparent
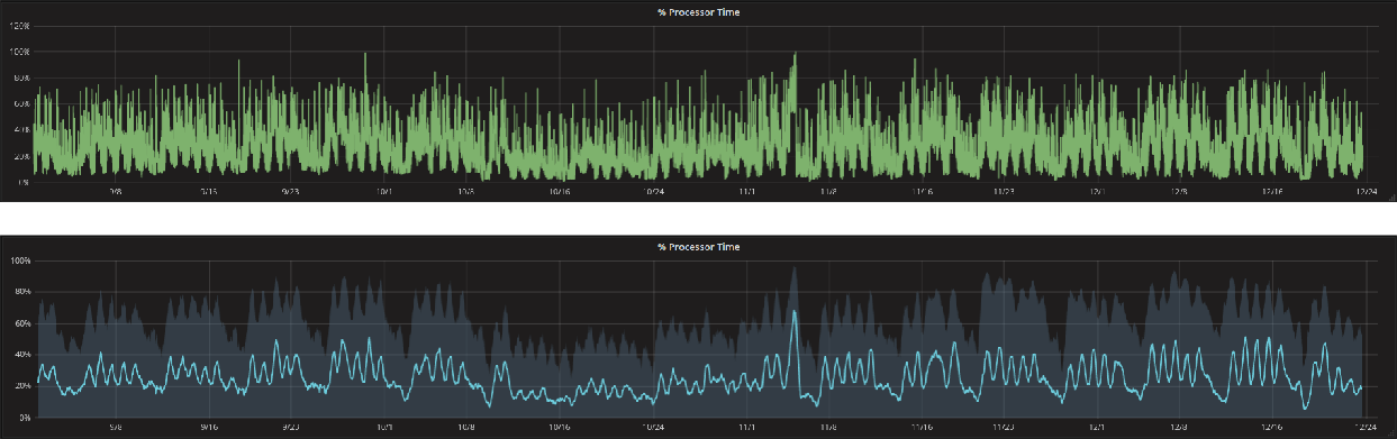
One of the key features of the homogeneous view is the smoothed curve (or running average) computed across the range of adjacent values. This way it becomes much easier to spot trends in the metrics and to develop a real understanding of what is happening on the system.
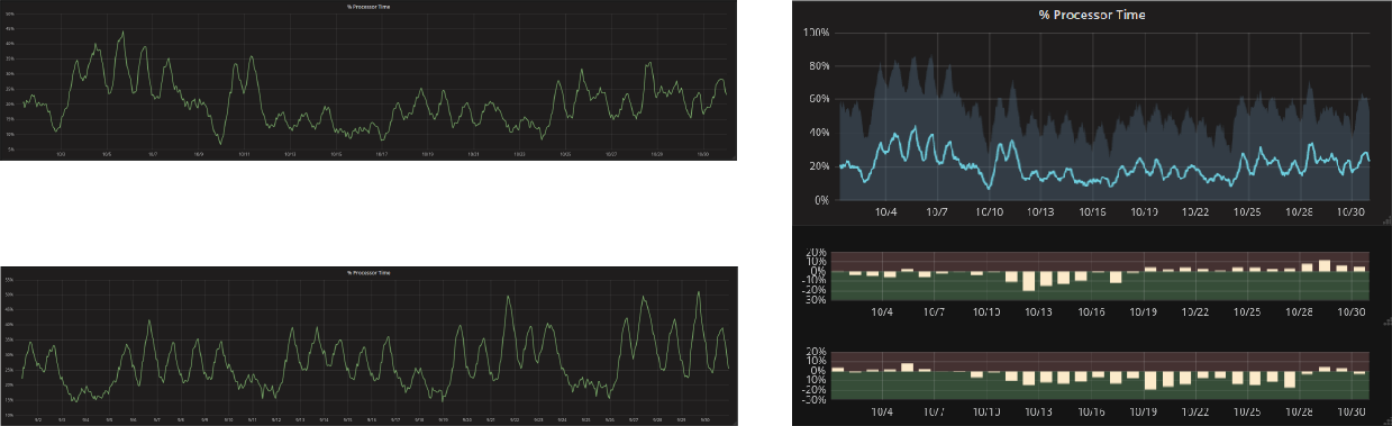
Combine current and historical data
An effect is an effect, but whether it is something new, something that has changed, or something that has never happened in the past can only be discovered by comparing time series data from two or more time intervals of interest. While this is quite a challenge with several standard tools, Würth Phoenix’s next level performance monitoring always allows you to present historic data side-by-side with current data, and each current effect can be analyzed while immediately taking into account changes with respect to the past.
Best support of human expert: faster, more accurate, a single place to go
You might have realized while reading about the features described above that it is not our goal to replace human experts. We want to give you the best support possible when trouble shooting network performance issues. Instead of wasting time switching between tools and searching for hints about where a problem might be hidden, we can present you with the data necessary to find a solution, all reachable from a single tool. This way you can spend your valuable time solving real problems instead continuing to search for them.
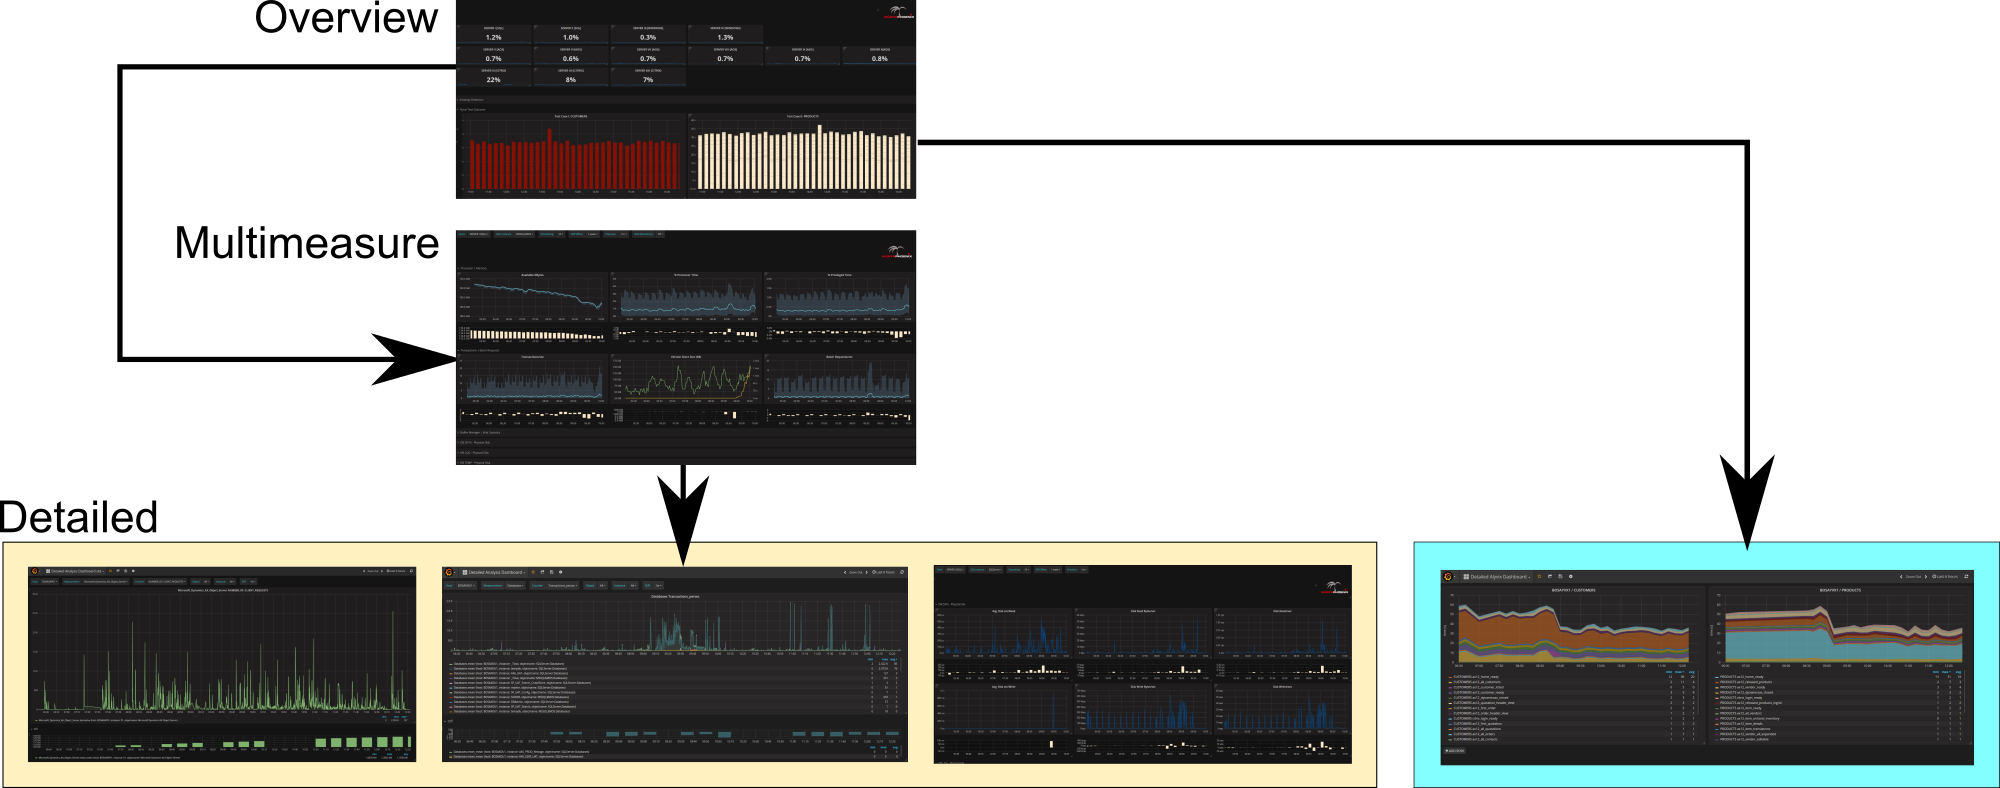
There are three levels of dashboards: a high level for getting a quick overview, a multimeasure level with a homogeneous view of all relevant measures, and the possibility to drill down to the lowest level with details on each single metric. Does this seem relevant for you? To find out more, don’t hesitate to contact a Würth Phoenix consultant and don’t miss our upcoming blog entry on this topic: Next Level Performance Monitoring – Part 2, where we investigate the role of machine learning and anomaly detection within our solution.


Susanne Greiner
Hi there! My name is Susanne and I joined Würth-Phoenix early in 2015. Ever since I can remember computers and the perfection that can be reached by them have been very fascinating for me. I built my first personal PC using components from about 20 broken ones at the age of 11 and fell in love with open source, visualization and data analysis shortly afterwards. I hold a master in experimental physics (University of Erlangen, Germany) and a PhD in computer science (Universtiy of Trento, Italy) my main interests are machine learning, visualization techniques, statistics and optimization. As long as an algorithm of mine runs at night and I get new interesting results the morning after I am able to sleep well. Beside computers I also like music, inline skating, and skiing.
Author
Latest posts by Susanne Greiner
21. 09. 2018
NetEye, Service Management
HackTheAlps Challenge with Würth Phoenix
04. 04. 2018
Anomaly Detection, Events, ITOA, NetEye
Würth Phoenix @ GrafanaConEu 2018
27. 03. 2018
Anomaly Detection, ITOA, NetEye, Visual Synthetic Monitoring
Multi-Level Dashboarding with Grafana – Use Case: NetEye ITOA | Alyvix
13. 11. 2017
NetEye
Deep Learning – a Recent Trend and Its Potential