30. 06. 2026
Azure, Cloud, Microsoft, NetEye, NetEye Extension Packs, Unified Monitoring

21. 12. 2018
Giuseppe Di Garbo
ITOA, NetEye, Service Management
How to Back Up All of Your Grafana Dashboards
Grafana has become one of the most used modules of NetEye. As many of you know, it’s very easy to export and import individual Grafana dashboards using the existing export functionality via JSON. [1]
Unfortunately, there is no quick and easy way to export all dashboards and data sources at once and then implement a process to back them up.
In my recent consulting projects, I needed to do just that and found an open source project available on GitHub[2]called grafana-backup-toolthat answers precisely this need. In this post I will show you how to use these scripts with NetEye.
Requirements
The requirements are as follows:
- Python 2.7 (with the Requests library)
- A Grafana 3.0 API token
To check whether it is already available on your system, or if you need to install python 2.7 and the python-requestspackages, just use the following yum command:
# yum install python27-python python-requests
Loaded plugins: fastestmirror, refresh-packagekit, security
Setting up Install Process
Loading mirror speeds from cached hostfile
Package python27-python-2.7.13-3.el6.x86_64 already installed and latest version
Package python-requests-2.6.0-4.el6.noarch already installed and latest version
Nothing to do
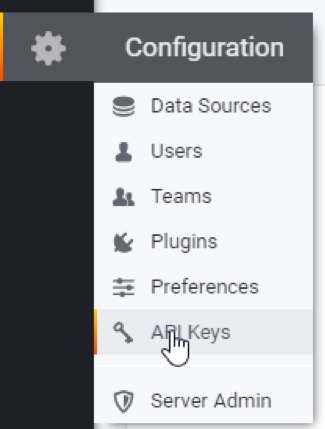
Beginning with version 3.0, Grafana allows authentication via an API token. [3] To create an API key, open the side menu, click the Configuration dropdown and select the API Keys option.
Create a user as in the example below. The Viewer roleis sufficient to back up dashboards. For a full backup of both dashboards and data sources, the Admin role is required.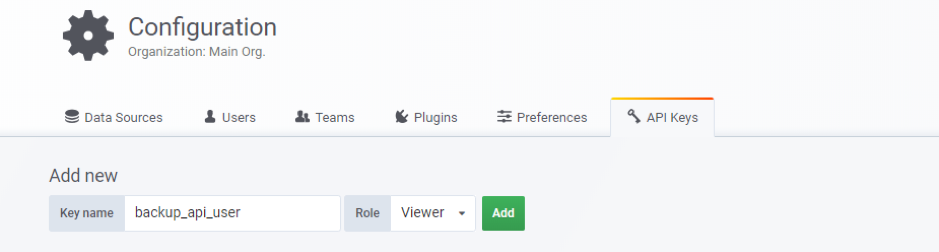
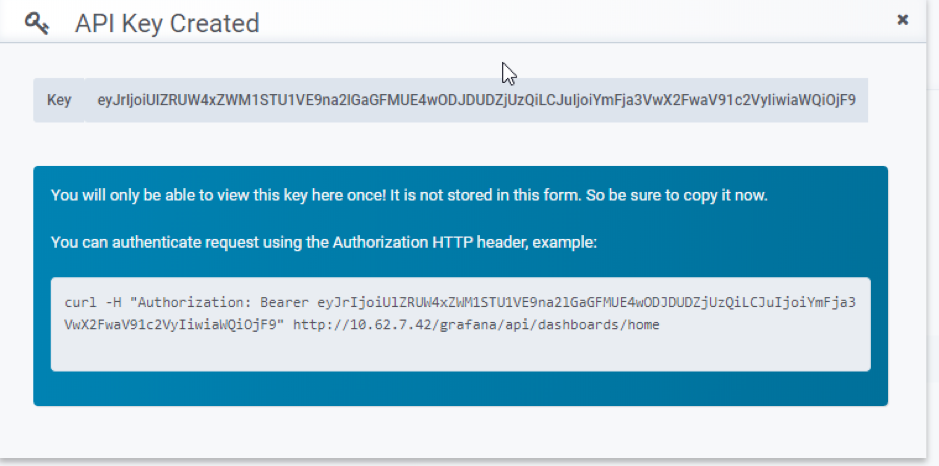
Save the generated API key displayed in the popup window.
Configuration and Use of grafana-backup-tool
After downloading the backup tool, you will need to configure the graphanaSettings.pyfile by adjusting the following two parameters:
- GRAFANA_URL (for NetEye, you must use the following local URL: http://127.0.0.1/grafana-local/)
- GRAFANA_TOKEN (use the API token you created above)
Here is an example of a grafanaSettings.pyconfiguration:
import os
grafana_url = os.getenv(‘GRAFANA_URL’, ‘http://127.0.0.1/grafana-local/‘)
token = os.getenv(‘GRAFANA_TOKEN’, ‘eyJrIjoiaXBWNHRUSm5sRmJYeDNxdkE0VWZmSDg1eExKWFlQU0siLDJuIjoiYmF3a3awX2FwaV91c2VyIiwiaWQiOjF9’)
http_get_headers = {‘Authorization’: ‘Bearer ‘ + token}
http_post_headers = {‘Authorization’: ‘Bearer ‘ + token, ‘Content-Type’: ‘application/json’}
We have finished the most difficult part, now we just have to try the script. Here are some simple usage examples, which are well documented on the project’s website.[2]
Using saveDashboards.pyto save each dashboard as a separate file in a specific folder
# python saveDashboards.py /tmp/grafana-backup/
search dashboard in grafana:
There are 15 dashboards:
All Services of a Host
Apache Logs
Availability Dashboard
Availability Details Dashboard
Business Process Overview
LAMP Apache Metrics
LAMP Apache Metrics v2
LAMP Linux OS Metrics
LAMP MySQL Metrics
LAMP Performance Overview
Network Analysis
Performance Data
Tactical Monitoring Overview
Test
Windows Systems Overview

########################################

dashboard:All Services of a Host are saved to /tmp/grafana-backup//All Services of a Host.dashboard
query dashboard:db/apache-logs, status:200
dashboard:Apache Logs are saved to /tmp/grafana-backup//Apache Logs.dashboard
query dashboard:db/availability-dashboard, status:200
dashboard:Availability Dashboard are saved to /tmp/grafana-backup//Availability Dashboard.dashboard
query dashboard:db/availability-details-dashboard, status:200
dashboard:Availability Details Dashboard are saved to /tmp/grafana-backup//Availability Details Dashboard.dashboard
query dashboard:db/business-process-overview, status:200
dashboard:Business Process Overview are saved to /tmp/grafana-backup//Business Process Overview.dashboard
query dashboard:db/lamp-apache-metrics, status:200
dashboard:LAMP Apache Metrics are saved to /tmp/grafana-backup//LAMP Apache Metrics.dashboard
query dashboard:db/lamp-apache-metrics-v2, status:200
dashboard:LAMP Apache Metrics v2 are saved to /tmp/grafana-backup//LAMP Apache Metrics v2.dashboard
query dashboard:db/lamp-linux-os-metrics, status:200
dashboard:LAMP Linux OS Metrics are saved to /tmp/grafana-backup//LAMP Linux OS Metrics.dashboard
query dashboard:db/lamp-mysql-metrics, status:200
dashboard:LAMP MySQL Metrics are saved to /tmp/grafana-backup//LAMP MySQL Metrics.dashboard
query dashboard:db/lamp-performance-overview, status:200
dashboard:LAMP Performance Overview are saved to /tmp/grafana-backup//LAMP Performance Overview.dashboard
query dashboard:db/network-analysis, status:200
dashboard:Network Analysis are saved to /tmp/grafana-backup//Network Analysis.dashboard
query dashboard:db/performance-data, status:200
dashboard:Performance Data are saved to /tmp/grafana-backup//Performance Data.dashboard
query dashboard:db/tactical-monitoring-overview, status:200
dashboard:Tactical Monitoring Overview are saved to /tmp/grafana-backup//Tactical Monitoring Overview.dashboard
query dashboard:db/test, status:200
dashboard:Test are saved to /tmp/grafana-backup//Test.dashboard
query dashboard:db/windows-systems-overview, status:200
dashboard:Windows Systems Overview are saved to /tmp/grafana-backup//Windows Systems Overview.dashboard
Using saveDatasources.pyto save each data source as a separate file in a specific folder
# python saveDatasources.py /tmp/grafana-backup/
search datasources in grafana:
There are 9 datasources:
datasource:erizone is saved to /tmp/grafana-backup//erizone.datasource
datasource:glpi is saved to /tmp/grafana-backup//glpi.datasource
datasource:monitoring_availability is saved to /tmp/grafana-backup//monitoring_availability.datasource
datasource:monitoring_outages is saved to /tmp/grafana-backup//monitoring_outages.datasource
datasource:monitoring_perfdata is saved to /tmp/grafana-backup//monitoring_perfdata.datasource
datasource:neteye is saved to /tmp/grafana-backup//neteye.datasource
datasource:netflow is saved to /tmp/grafana-backup//netflow.datasource
datasource:perfdata is saved to /tmp/grafana-backup//perfdata.datasource
datasource:thruk is saved to /tmp/grafana-backup//thruk.datasource
Use backup_grafana.shto back up all your dashboards, data sources and folders to the /tmp folder
[root@neteye grafana-backup-tool]# ./backup_grafana.sh
2018-12-19_16:24:08
search dashboard in grafana:
There are 15 dashboards:
All Services of a Host
Apache Logs
Availability Dashboard
Availability Details Dashboard
Business Process Overview
LAMP Apache Metrics
LAMP Apache Metrics v2
LAMP Linux OS Metrics
LAMP MySQL Metrics
LAMP Performance Overview
Network Analysis
Performance Data
Tactical Monitoring Overview
Test
Windows Systems Overview
########################################
query dashboard:db/all-services-of-a-host, status:200
dashboard:All Services of a Host are saved to /tmp/dashboards/2018-12-19_16:24:08/All Services of a Host.dashboard
query dashboard:db/apache-logs, status:200
dashboard:Apache Logs are saved to /tmp/dashboards/2018-12-19_16:24:08/Apache Logs.dashboard
query dashboard:db/availability-dashboard, status:200
dashboard:Availability Dashboard are saved to /tmp/dashboards/2018-12-19_16:24:08/Availability Dashboard.dashboard
query dashboard:db/availability-details-dashboard, status:200
dashboard:Availability Details Dashboard are saved to /tmp/dashboards/2018-12-19_16:24:08/Availability Details Dashboard.dashboard
query dashboard:db/business-process-overview, status:200
dashboard:Business Process Overview are saved to /tmp/dashboards/2018-12-19_16:24:08/Business Process Overview.dashboard
query dashboard:db/lamp-apache-metrics, status:200
dashboard:LAMP Apache Metrics are saved to /tmp/dashboards/2018-12-19_16:24:08/LAMP Apache Metrics.dashboard
query dashboard:db/lamp-apache-metrics-v2, status:200
dashboard:LAMP Apache Metrics v2 are saved to /tmp/dashboards/2018-12-19_16:24:08/LAMP Apache Metrics v2.dashboard
query dashboard:db/lamp-linux-os-metrics, status:200
dashboard:LAMP Linux OS Metrics are saved to /tmp/dashboards/2018-12-19_16:24:08/LAMP Linux OS Metrics.dashboard
query dashboard:db/lamp-mysql-metrics, status:200
dashboard:LAMP MySQL Metrics are saved to /tmp/dashboards/2018-12-19_16:24:08/LAMP MySQL Metrics.dashboard
query dashboard:db/lamp-performance-overview, status:200
dashboard:LAMP Performance Overview are saved to /tmp/dashboards/2018-12-19_16:24:08/LAMP Performance Overview.dashboard
query dashboard:db/network-analysis, status:200
dashboard:Network Analysis are saved to /tmp/dashboards/2018-12-19_16:24:08/Network Analysis.dashboard
query dashboard:db/performance-data, status:200
dashboard:Performance Data are saved to /tmp/dashboards/2018-12-19_16:24:08/Performance Data.dashboard
query dashboard:db/tactical-monitoring-overview, status:200
dashboard:Tactical Monitoring Overview are saved to /tmp/dashboards/2018-12-19_16:24:08/Tactical Monitoring Overview.dashboard
query dashboard:db/test, status:200
dashboard:Test are saved to /tmp/dashboards/2018-12-19_16:24:08/Test.dashboard
query dashboard:db/windows-systems-overview, status:200
dashboard:Windows Systems Overview are saved to /tmp/dashboards/2018-12-19_16:24:08/Windows Systems Overview.dashboard
########################################
search datasources in grafana:
There are 9 datasources:
datasource:erizone is saved to /tmp/datasources/2018-12-19_16:24:08/erizone.datasource
datasource:glpi is saved to /tmp/datasources/2018-12-19_16:24:08/glpi.datasource
datasource:monitoring_availability is saved to /tmp/datasources/2018-12-19_16:24:08/monitoring_availability.datasource
datasource:monitoring_outages is saved to /tmp/datasources/2018-12-19_16:24:08/monitoring_outages.datasource
datasource:monitoring_perfdata is saved to /tmp/datasources/2018-12-19_16:24:08/monitoring_perfdata.datasource
datasource:neteye is saved to /tmp/datasources/2018-12-19_16:24:08/neteye.datasource
datasource:netflow is saved to /tmp/datasources/2018-12-19_16:24:08/netflow.datasource
datasource:perfdata is saved to /tmp/datasources/2018-12-19_16:24:08/perfdata.datasource
datasource:thruk is saved to /tmp/datasources/2018-12-19_16:24:08/thruk.datasource
########################################
search folder in grafana:
There are 0 folders:
I hope you will find this tool useful, too!
[1]To read more about the Grafana Export and Import click here.
[2]To read more about the GitHub grafana-backup-tool project click here.
[3]To read more about the Grafana authentication API click here.

Giuseppe Di Garbo
Consultant at Würth IT Italy
Hi everybody. I’m Giuseppe and I was born in Milan in 1979. Since the early years of university, I was attracted by the Open Source world and operating system GNU\Linux. After graduation I had the opportunity to participate in a project of a startup for the realization of an Internet Service Provider. Before joining Würth Phoenix (now Würth IT Italy) as SI consultant, I gained great experience as an IT consultant on projects related to business continuity and implementation of open source software compliant to ITIL processes of incident, change and service catalog management. My free time is completely dedicated to my wife and, as soon as possible, run away from Milan and his caotic time and trekking discover our beautiful mountain near Lecco for relax and lookup the (clean) sky.
Author
Latest posts by Giuseppe Di Garbo
23. 06. 2026
Atlassian
Customer Feedback in Jira Service Management: CSAT and Native Surveys Explained
19. 12. 2025
Atlassian, Service Management
Jira Service Management Customer Detail Fields: A Practical Use Case
29. 09. 2025
Atlassian, Service Management
Streamlining Service Request Management with ITIL4 and Jira Service Management
30. 06. 2025
Atlassian, Service Management
Creating Jira Service Management Requests from a Public Website? Here’s the Secure, No-API Way