10. 07. 2026
APM, Log Management, Log-SIEM

NetEye 4 is based on Icinga 2. How can we monitor it? There are several options available; here I choose Icingabeat and test it.
Icingabeat is an Elastic Beat that fetches data from the Icinga 2 API and sends it directly to either Elasticsearch or Logstash. In my case, I wanted to send the information directly to Elasticsearch.
Beats are great for gathering data. They sit on servers, and then centralize data in Elasticsearch. And if it needs more processing muscle, Beats can also ship the data to Logstash for transformation and parsing. Beats gather logs and metrics from unique environments and document them with essential metadata from hosts, container platforms like Docker and Kubernetes, and cloud providers, before forwarding them on to the Elastic Stack.
The first step is to install Icingabeat. There are several different ways to do this, but I chose to install the package with yum.
After finishing the installation, I started to configure the file icingabeat.yml. I set different parameters like the hostname, port number, and login credentials of the Icinga API endpoint. In the same file, I set the parameter that tells Elasticsearch and Kibana to use the Elastic Stack 6.2 present in NetEye 4. I then used the NetEye 4 Log Manager that comes pre-installed when Search Guard is integrated. Search Guard is a security plugin for Elasticsearch and the entire Elastic Stack that offers encryption, authentication, authorization, auditing, logging, multi-tenancy and compliance features. Log Manager allowed me to verify that Elastic Stack, Search Guard and Icingabeat were properly integrated.
When I finished configuring that file, I started the icingabeat service. I then imported the dashboard for monitoring Icinga 2 following the documentation from the Icingabeat site:
# icingabeat setup -E setup.kibana.host=127.0.0.1:5601 -E setup.kibana.username=admin -E setup.kibana.password=secret
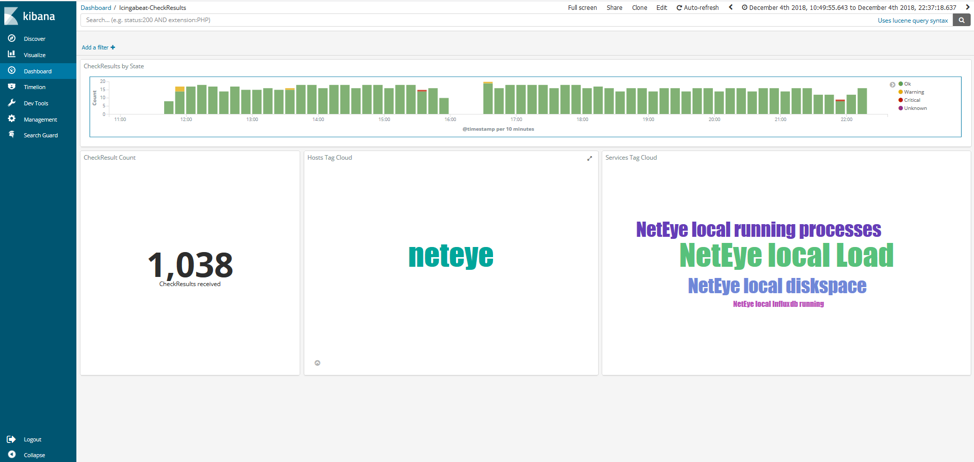
Then I selected the Log Analytics module of NetEye, opened the new dashboard import with Icingabeat, and voilà!
Icingabeat Check Result
Icingabeat Status
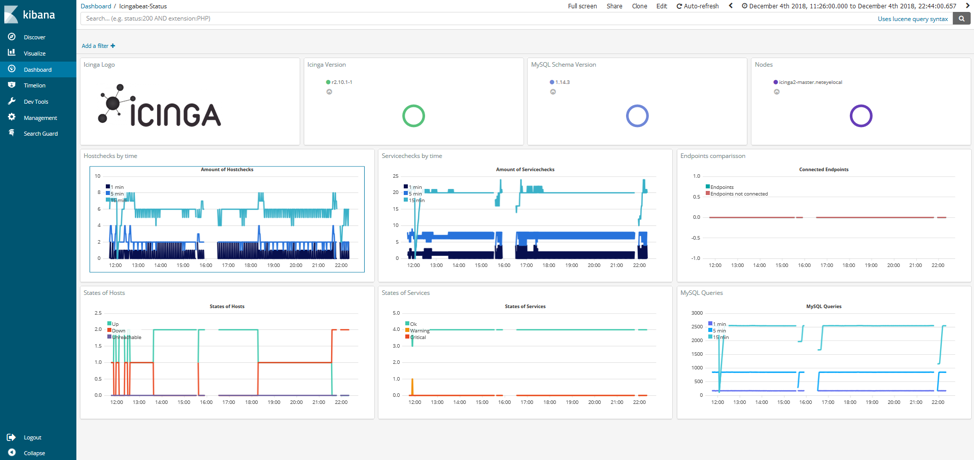
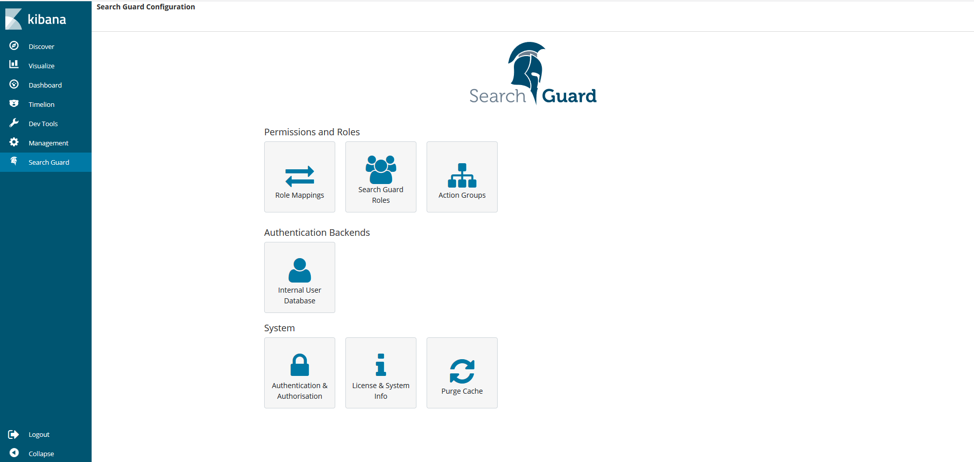
Now I can explore data collection from Icingabeat with just a few clicks and analyze the status of any service. The data is stored in a new index icingabeat-* that was created during the installation and configuration of the dashboard. Then, with the power of Search Guard, I can select who can see the index (authorization) in NetEye by clicking on the Search Guard link. I can also select which users can access (authentication) this information, either with an internal user database or by attaching to Active Directory or some other LDAP service.
Clicking on the Search Guard link when logged in as the admin user of Search Guard shows the various functionalities implemented in the following screenshot:
Franco Federico
Hi, I’m Franco and I was born in Monza. For 20 years I worked for IBM in various roles. I started as a customer service representative (help desk operator), then I was promoted to Windows expert. In 2004 I changed again and was promoted to consultant, business analyst, then Java developer, and finally technical support and system integrator for Enterprise Content Management (FileNet). Several years ago I became fascinated by the Open Source world, the GNU\Linux operating system, and security in general. So for 4 years during my free time I studied security systems and computer networks in order to extend my knowledge. I came across several open source technologies including the Elastic stack (formerly ELK), and started to explore them and other similar ones like Grafana, Greylog, Snort, Grok, etc. I like to script in Python, too. Then I started to work in Würth Phoenix like consultant. Two years ago I moved with my family in Berlin to work for a startup in fintech(Nuri), but the startup went bankrupt due to insolvency. No problem, Berlin offered many other opportunities and I started working for Helios IT Service as an infrastructure monitoring expert with Icinga and Elastic, but after another year I preferred to return to Italy for various reasons that we can go into in person 🙂 In my free time I continue to dedicate myself to my family(especially my daughter) and I like walking, reading, dancing and making pizza for friends and relatives.
Author
Latest posts by Franco Federico
10. 06. 2026
Unified Monitoring
Transform Metrics into Alerts
10. 03. 2026
Unified Monitoring
Elastic AutoOps in NetEye: Simplifying Elasticsearch Operations with Real-Time Intelligence
09. 09. 2025
NetEye
Backing up a MariaDB Galera Cluster
12. 06. 2025
NetEye, Unified Monitoring
From Monitoring to SOC