


31. 03. 2026
Log-SIEM, NetEye, Unified Monitoring

In one of my previous posts I described how to create a customized NetEye 3 Tactical Monitoring Overview dashboard with Grafana and Telegraf. Here I’d like to show you how you can create a similar dashboard (much faster) for NetEye 4.
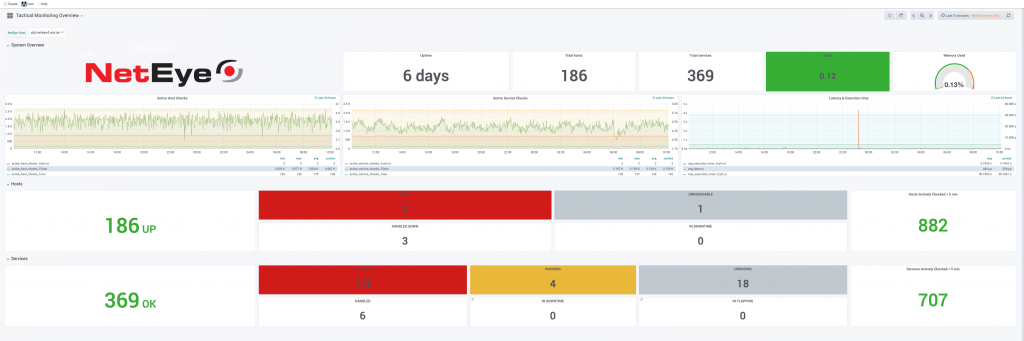
The NetEye 4 Tactical Overview quickly provides basic information on the status of hosts, services and typical daily IT operations such as acknowledgements.
If we want to customize it by adding Grafana panels of, for example, some performance indicators of the monitoring system (say, host and service status, host and service check execution time, and host and service check latency) we will need to:
- Get the Icinga metrics related to the Tactical Overview
- Archive the Icinga metrics in InfluxDB
With NetEye 4 we can achieve both goals very quickly without using an external agent like Telegraf.
To get the main performance data it is sufficient to use the icinga command of ITL (the Icinga Template Library). The archiving of Icinga metrics in InfluxDB is done automatically in NetEye4 using the InfluxdbWriter component.
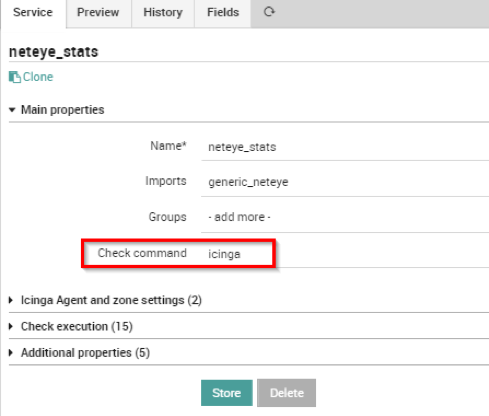
The icinga check command was developed as a built-in check, and returns performance data for the current Icinga instance. From the Icinga Director menu you will need to create a new service template named (for example) neteye_stats and associate it with the icinga check command.
Finally you need to create a new service check based on this service template and associate it with the NetEye host:
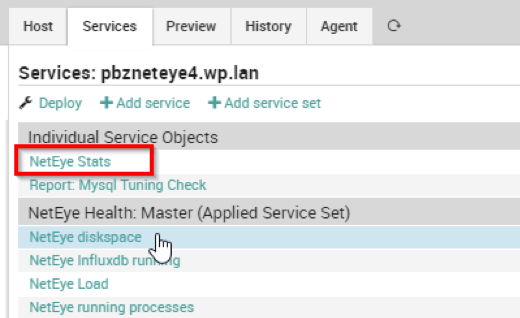
After the deployment of this configuration we will have a new service check associated with the NetEye host that produces the desired indicators from the available Performance Data.
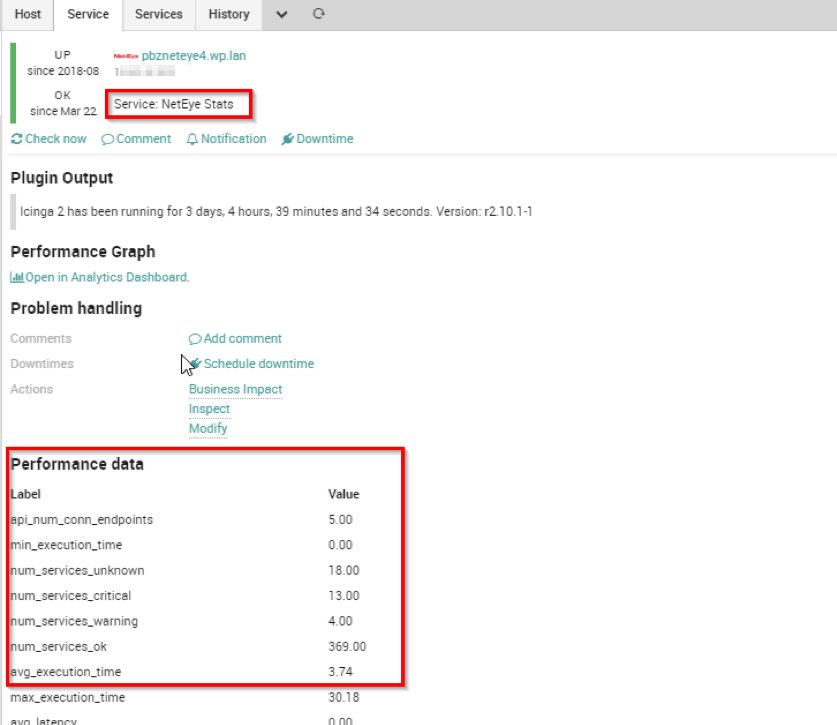
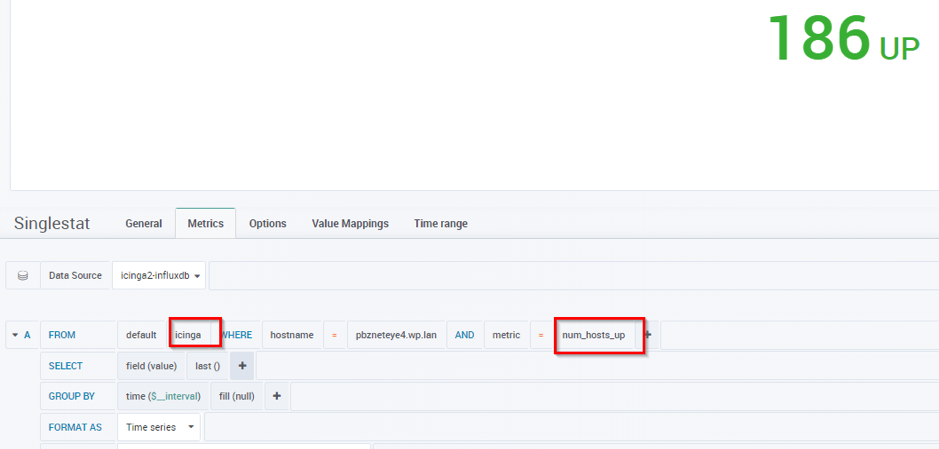
Thanks to this new service check for InfluxDB, the data related to the Performance Data reported above are associated with the NetEye host and will be automatically logged. So we can get, for example, the number of hosts with status UP by selecting the num_host_up field:
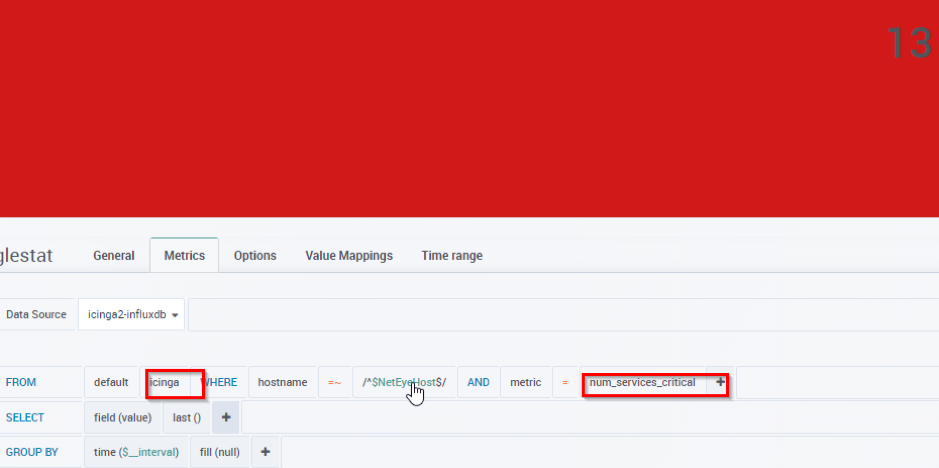
Or the number of services in critical by selecting the num_services_critical field:
Thanks to this simple configuration you will be able to obtain a completely customized Tactical Monitoring Overview in which it is possible to integrate additional information on the operating status of your NetEye 4 system, highlighting the indicators that you consider most useful or interesting.

Giuseppe Di Garbo
Consultant at Würth IT Italy
Hi everybody. I’m Giuseppe and I was born in Milan in 1979. Since the early years of university, I was attracted by the Open Source world and operating system GNU\Linux. After graduation I had the opportunity to participate in a project of a startup for the realization of an Internet Service Provider. Before joining Würth Phoenix (now Würth IT Italy) as SI consultant, I gained great experience as an IT consultant on projects related to business continuity and implementation of open source software compliant to ITIL processes of incident, change and service catalog management. My free time is completely dedicated to my wife and, as soon as possible, run away from Milan and his caotic time and trekking discover our beautiful mountain near Lecco for relax and lookup the (clean) sky.
Author
Latest posts by Giuseppe Di Garbo
19. 12. 2025
Atlassian, Service Management
Jira Service Management Customer Detail Fields: A Practical Use Case
29. 09. 2025
Atlassian, Service Management
Streamlining Service Request Management with ITIL4 and Jira Service Management
30. 06. 2025
Atlassian, Service Management
Creating Jira Service Management Requests from a Public Website? Here’s the Secure, No-API Way
28. 03. 2025
Atlassian, Service Management
Effortless On-Call Management with Jira Service Management