22. 05. 2026
AI, NetEye, Unified Monitoring

Scenario
A lot of people who have a NetEye monitoring system will set up a Wall Dashboard to display the status of their most important services and vital performance data.
If these Dashboards are built using Grafana (in the ITOA menu in NetEye 4), you will encounter the problem that you will need to bypass the initial NetEye login screen where it prompts you for credentials.
Anonymous Access: Security Notice
Here is a way to enable anonymous access to Grafana. However, it’s important to protect it by only allowing access from the Wall Dashboards!
Furthermore, it’s possible to restrict anonymous access to a specific Grafana Organization, publishing only those Dashboards there that can be publicly accessible.
Web Server Configuration
The configuration is quite simple: we will need to create a new web service without authentication.
To do this, connect to NetEye and edit the file:
/etc/httpd/conf/httpd.conf
Now add a second listener just under the line “Listen 80”:
Listen 81
Then add the following block at the end of the configuration file:
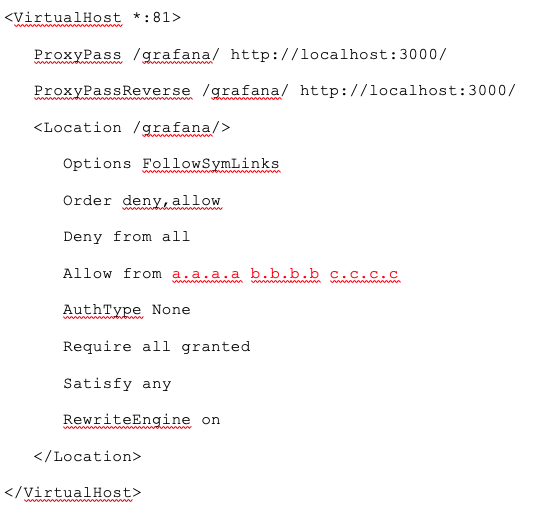
Note: Put all the IP addresses for the Wall Dashboard in the line “Allow from”, which is indicated above as a.a.a.a b.b.b.b c.c.c.c. For NetEye 4, you need to configure the:
firewall-cmd --permanent --add-port=81/tcp
firewall-cmd –reload
Then the httpd service must be restarted:
- NetEye 3: service httpd restart
- Neteye 4: systemctl restart httpd.service
Grafana Configuration
The second configuration step is to enable anonymous access in Grafana. Open the file:
- NetEye 3: /var/lib/neteye/grafana/etc/grafana.ini
- NetEye 4: /neteye/shared/grafana/conf/grafana.ini
Look for the [auth.anonymous] section and edit it as follows:
[auth.anonymous]
# enable anonymous access
enabled = true
# specify organization name that should be used for unauthenticated users
org_name = "Main Org."
# specify role for unauthenticated users
org_role = Viewer
The Organization “Main Org.” is the default one. You can change it to another existing Grafana Organization name to limit the number of visible Dashboards.
The final step is to restart the grafana-server service:
- NetEye 3: service grafana-server restart
- Neteye 4: systemctl restart grafana-server.service
Anonymous Access from Wall Dashboards
Now our configuration is finished. You can now access the Wall Dashboards using this web link:
(where “neteye” is the name of your NetEye server)

Alessandro Romboli
Site Reliability Engineer at Würth IT Italy
My name is Alessandro and I joined Würth Phoenix (now Würth IT Italy) early in 2013. I have over 20 years of experience in the IT sector: For a long time I've worked for a big Italian bank in a very complex environment, managing the software provisioning for all the branch offices. Then I've worked as a system administrator for an international IT provider supporting several big companies in their infrastructures, providing high availability solutions and disaster recovery implementations. I've joined the VMware virtual infrastructure in early stage, since version 2: it was one of the first productive Server Farms in Italy. I always like to study and compare different technologies: I work with Linux, MAC OSX, Windows and VMWare. Since I joined Würth Phoenix, I could also expand my experience on Firewalls, Storage Area Networks, Local Area Networks, designing and implementing complete solutions for our customers. Primarily, I'm a system administrator and solution designer, certified as VMware VCP6 DCV, Microsoft MCP for Windows Server, Hyper-V and System Center Virtual Machine Manager, SQL Server, SharePoint. Besides computers, I also like photography, sport and trekking in the mountains.
Author
Latest posts by Alessandro Romboli
03. 12. 2025
Microsoft
Single Sign-On for Power BI Report Server
08. 09. 2025
Service Management
VMware ESXi Transparent Page Sharing
12. 06. 2025
Microsoft
Terminal Server User Profiles with FSLogix
05. 02. 2025
Knowledge Management, Service Management
Dynamics 365 Finance & Operations (On -Premises) Connectivity: New Authentication Model