
ITOA
ITOA is the NetEye component which represents time series data using the Grafana graphics engine.
Data is usually collected by Telegraf agents and stored into an InfluxDB specialized non-relational database.
Flux
In order to manipulate the time series data, Grafana usually adopted a relational language: InfluxQL.
The relational approach has had a number of limitations in manipulating data, so in the last few years a new more powerful language has appeared: Flux. Flux has now emerged from the beta stage and is the preferred language to use inside Grafana.
Flux is a data scripting and query language that increases productivity and code reuse.
Flux is composable: Developers can build on top of the language for specific use cases. You can include other Flux modules in the code and contribute new functions to the platform.
The ability to integrate with other systems is a core design feature of Flux. Integrate disparate data sources, including databases, third-party APIs or filesystems anywhere data lives.
A very basic outline of the Flux scripting used inside Grafana is that it:
- Retrieves a specified amount of data from a source
- Filters data based on time or column values
- Processes and shapes data into expected results
- Returns the result
In this flow, the pipe-forward operator |> sends the output of one function as input to the next function.
Here’s an example of a basic Flux query used inside Grafana:
from(bucket: "example-bucket")              // ── DataSource (typically InfluxDB)
    |> range(start: -1d)                    // ── Filter on time
    |> filter(fn: (r) => r._field == "foo") // ── Filter on column values
    |> group(columns: ["sensorID"])         // ── Shape
    |> mean()                               // ── Process
    |> yield()                              // ── Returns data to Grafana
Scripting
Flux is a powerful scripting language: it can use variables to store intermediate results during complex calculations.
Below is an example of a graph showing the comparison between time series data and the values that the same time series have had in the past.
This calculation is very easy using Flux, but it would be impossible with the old InfluxQL !
Historical comparison
Let’s start with a simple series Percent_Processor_Time which can be rendered in Grafana with a time series graph.
The following Flux query filters processor data from a single host using a Grafana variable $host:
from(bucket: v.defaultBucket)
  |> range(start: v.timeRangeStart, stop: v.timeRangeStop)   // ── Grafana dashboard time range
  |> filter(fn: (r) =>
      r._measurement == "Processor" and
      r._field == "Percent_Processor_Time" and
      r.instance == "_Total" and
      r.host == "$host")
  |> aggregateWindow(every: $diff_group, fn: mean)   // ── reduce the number of data points
  |> keep(columns: ["_time", "_value"])
  |> yield()                     // ── returns data to Grafana for rendering
The same Flux query could be run twice, one for current data and one for the same data in the past. The two results are finally joined to calculate the difference between the two series:
import "experimental"
MyStart = time(v: v.timeRangeStart)
MyStop = time(v: v.timeRangeStop)
OffsetStart = experimental.addDuration(d: -$diff,  to: MyStart)     // ── calculates a new time range in the past
OffsetStop = experimental.addDuration(d: -$diff,  to: MyStop)     // ── $diff is the comparison offset (ex. 1 week ago)
histdata = from(bucket: v.defaultBucket)
  |> range(start: OffsetStart, stop: OffsetStop)     // ── get historical data from the past
  |> filter(fn: (r) =>
      r._measurement == "Processor" and
      r._field == "Percent_Processor_Time" and
      r.instance == "_Total" and
      r.host == "$host")
  |> aggregateWindow(every: $diff_group, fn: mean)
  |> map(fn: (r) => ({
      _time: experimental.addDuration(d: $diff,  to: r._time),     // ── change the time field of the hist data to match the current one
      _value: r._value
    }))
currdata = from(bucket: v.defaultBucket)
  |> range(start: MyStart, stop: MyStop)     // ── get the current data series
  |> filter(fn: (r) =>
      r._measurement == "Processor" and
      r._field == "Percent_Processor_Time" and
      r.instance == "_Total" and
      r.host == "$host")
  |> aggregateWindow(every: $diff_group, fn: mean)
  |> keep(columns: ["_time", "_value"])
join(
    tables: {hist:histdata, curr:currdata},
    on: ["_time"]        // ── I can join on time field because I’ve changed the time field of the historical data !
  )
  |> map(fn: (r) => ({
    _time: r._time,
    _value: (r._value_curr - r._value_hist),     // ── I’m interested in the difference between current and past values
    _field: "difference"     // ── label the result as difference
  }))
  |> yield()                     // ── returns data to Grafana for rendering
The result in Grafana using a bar style graph is shown here:
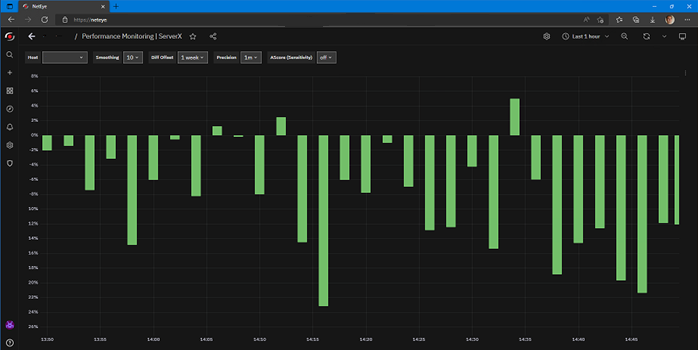
I can change the diff offset on the fly using a Grafana variable to see different metric comparisons.
Conclusion
This was just a little example of the power of the Flux language to manipulate time series data.
With a little of training, the language can easily replace the old and limited InfluxQL
These Solutions are Engineered by Humans
Are you passionate about performance metrics or other modern IT challenges? Do you have the experience to drive solutions like the one above? Our customers often present us with problems that need customized solutions. In fact, we’re currently hiring for roles like this as well as other roles here at Würth Phoenix.


Alessandro Romboli
Site Reliability Engineer at Würth IT Italy
My name is Alessandro and I joined Würth Phoenix (now Würth IT Italy) early in 2013. I have over 20 years of experience in the IT sector: For a long time I've worked for a big Italian bank in a very complex environment, managing the software provisioning for all the branch offices. Then I've worked as a system administrator for an international IT provider supporting several big companies in their infrastructures, providing high availability solutions and disaster recovery implementations. I've joined the VMware virtual infrastructure in early stage, since version 2: it was one of the first productive Server Farms in Italy. I always like to study and compare different technologies: I work with Linux, MAC OSX, Windows and VMWare. Since I joined Würth Phoenix, I could also expand my experience on Firewalls, Storage Area Networks, Local Area Networks, designing and implementing complete solutions for our customers. Primarily, I'm a system administrator and solution designer, certified as VMware VCP6 DCV, Microsoft MCP for Windows Server, Hyper-V and System Center Virtual Machine Manager, SQL Server, SharePoint. Besides computers, I also like photography, sport and trekking in the mountains.
Author
Latest posts by Alessandro Romboli
03. 12. 2025
Microsoft
Single Sign-On for Power BI Report Server
08. 09. 2025
Service Management
VMware ESXi Transparent Page Sharing
12. 06. 2025
Microsoft
Terminal Server User Profiles with FSLogix
05. 02. 2025
Knowledge Management, Service Management
Dynamics 365 Finance & Operations (On -Premises) Connectivity: New Authentication Model