


16. 02. 2026
Unified Monitoring

Some days after installing an OpenShift cluster you may notice a warning related to insights: the system is complaining because metrics are not stored in a persistent way and a restart of the container may cause the loss of metrics.
In OpenShift it is possible to configure several custom metrics. In this post I will explain how to configure persistency only for default metrics but this solution can be easily applied also to custom metrics.
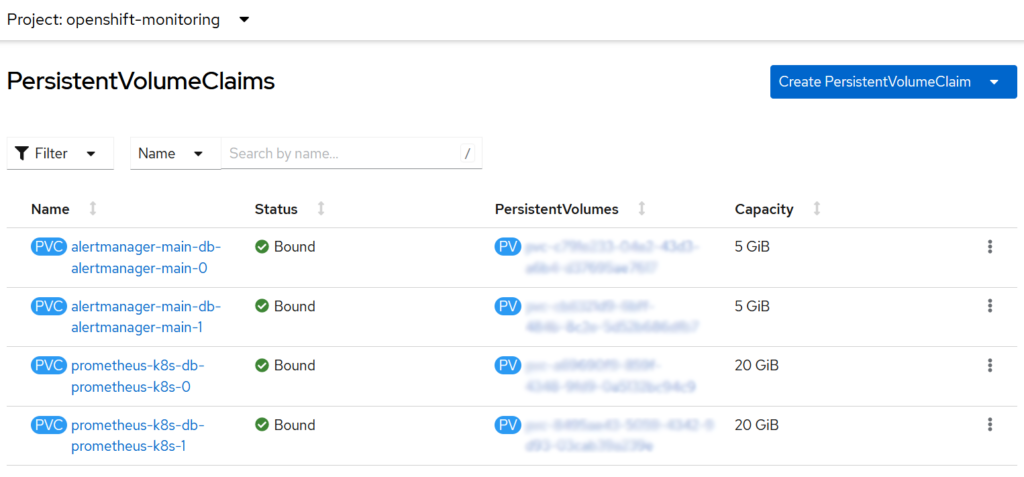
Basically you have to create volumes to store both Prometheus metrics and alerting system. Since there are 2 pods for both of them you need 4 PVCs.
If you use a solution like OpenShift GitOps (RedHat own version of ArgoCD) what you have to do is simply to create a configmap and push it, otherwise you may have to create this configuration manually.
apiVersion: v1
kind: ConfigMap
metadata:
  name: cluster-monitoring-config
  namespace: openshift-monitoring
data:
  config.yaml: |
    prometheusK8s:
      retention: 1m
      retentionSize: 19GB
      volumeClaimTemplate:
        spec:
          storageClassName: ocs-storagecluster-cephfs
          volumeMode: Filesystem
          resources:
            requests:
              storage: 20Gi

    alertmanagerMain:
      volumeClaimTemplate:
        spec:
          storageClassName: ocs-storagecluster-cephfs
          resources:
            requests:
              storage: 5Gi
The two configuration are quite self-explanatory and you can probably use them as in the example. The thing you have to pay attention to is use the correct storageClass: you have to check yours under Storage -> Storage Classes.
It is important also to set immediately a retention policy: you may find in a situation where it seems that Control Plane are disconnected because of the lack of metrics. If this happen you can recover the system deleting the PVCs shown in the screenshot above and re-running a sync with GitOps.
We didn’t set the retention policy for alerts and for the moment we didn’t have issues with that for the moment.
Reference: https://docs.openshift.com/container-platform/4.13/monitoring/configuring-the-monitoring-stack.html
These Solutions are Engineered by Humans
Did you find this article interesting? Are you an “under the hood” kind of person? We’re really big on automation and we’re always looking for people in a similar vein to fill roles like this one as well as other roles here at Würth Phoenix.

Alessandro Valentini
DevOps Engineer at Würth IT Italy
Platform Engineer at Würth IT Italy
Author
Latest posts by Alessandro Valentini
05. 08. 2025
DevOps, Kubernetes
Use S3 Storage with OpenShift Data Foundation
04. 03. 2025
Automation, DevOps, Service Management
Group-aware Reboot with Ansible
31. 12. 2024
DevOps
GitOps: Pull-based vs Push-based Approaches