
As you all known, JSON is a standard format used for exchanging data between applications.
This standard is adopted by practically every vendor and by many applications to make information available via REST API.
It is therefore very useful to exploit this information in standard format also in the monitoring field.
A concrete example that I want to show in this post has begun from a customer request relating to NATS monitoring (an open-source messaging system, which is also the default message broker in NetEye).
Starting from this request I identified an interesting possibility to use the metrics available on JSON pages which I will show below.
Initially I tried to find if there was an existing plugin ready to use to monitor NATS or a way to collect metrics via SNMP/REST API. But after a very educational discussion with the solution architect team that use NATS, I decided to the check some specific controls made available natively by the “monitoring” page of NATS itself (an excellent and very interesting example of what I said in the introduction).
In the “monitoring” page NATS expose many useful metrics in JSON format and for this reason I started looking for plugins capable of parsing JSON pages until I found the plugin check_http_json (a generic plugin for Nagios which checks json values from a given HTTP endpoint against argument specified rules and determines the status and performance data for that service).
I have tested check_http_json for a long time and I can confirm that it turns out to be very useful in these scenarios:
- identify if a specific JSON key exists (–key_exists option):
'/neteye/shared/monitoring/plugins/check_http_json.py' '-H' 'demo.nats.io' '-P' '8222' '-p' 'connz' '--key_exists' 'num_connections'
OK: Status OK.
- identify if a specific JSON key exists and produce the relative metrics (–key_exists and –key_metric options)
'/neteye/shared/monitoring/plugins/check_http_json.py' '-H' 'demo.nats.io' '-P' '8222' '-p' 'connz' '--key_exists' 'num_connections' '--key_metric' 'num_connections'
OK: 'num_connections'=14  Status OK. |'num_connections'=14
- return CRITICAL or WARNING if the key you are looking for does not exist (–key_exists and –key_metric options)
'/neteye/shared/monitoring/plugins/check_http_json.py' '-H' 'demo.nats.io' '-P' '8222' '-p' 'connz' '--key_exists_critical' 'mydummykey'
 CRITICAL: Status CRITICAL. Key mydummykey did not exist.

'/neteye/shared/monitoring/plugins/check_http_json.py' '-H' 'demo.nats.io' '-P' '8222' '-p' 'connz' '--key_exists' 'mydummykey'
 WARNING: Status WARNING. Key mydummykey did not exist.
- check the value related to a key over a threshold and produce a warning/critical situation with its metric in the perfdata (–critical and –key_metric options)
# '/neteye/shared/monitoring/plugins/check_http_json.py' '-H' 'demo.nats.io' '-P' '8222' '-p' 'connz' '--critical' 'num_connections,20:' '--key_metric' 'num_connections'
CRITICAL: 'num_connections'=10 Status CRITICAL. Value (14) for key num_connections was less than 20.|'num_connections'=10
- check the value related to a sub key over a threshold and produce a warning/critical situation (–critical and –key_metric options)
# '/neteye/shared/monitoring/plugins/check_http_json.py' '-H' 'demo.nats.io' '-P' '8222' '-p' 'accountz?acc=$G' --critical 'account_detail.sublist_stats.num_subscriptions,3000:' '--key_metric' 'num_subscriptions'
 CRITICAL: 'account_detail.sublist_stats.num_subscriptions'=117  Status CRITICAL. Value (117) for key account_detail.sublist_stats.num_subscriptions was less than 3000.|'num_subscriptions'=117
There are other controls made available by this plugin that I report below. For details, please refer to the plugin documentation.
–key_equals
–key_equals_critical
–key_equals_unknown
–key_not_equals_critical
By following this example it is therefore possible to control and monitor practically every specific parameter or metric made available by any vendor / device / application able to expose data in JSON.
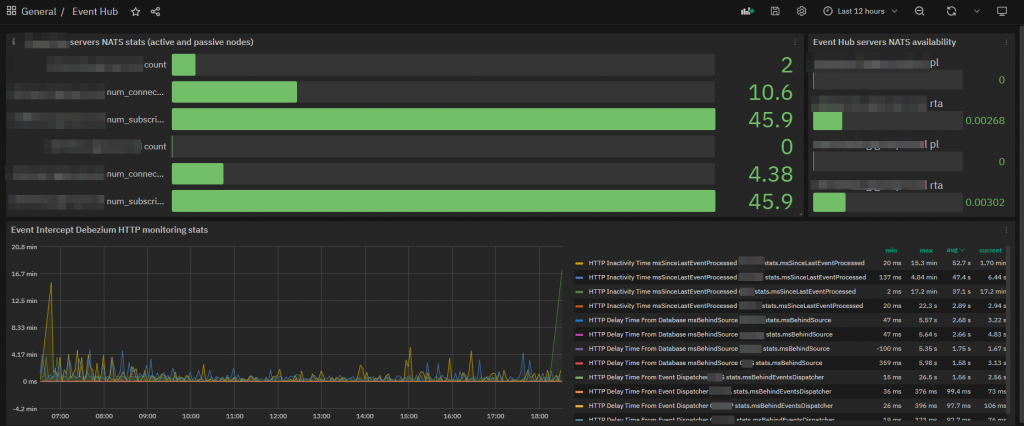
Furthermore, thanks to the historicized data in InfluxDB and Grafana, it is also possible to create specific dashboards with graphs that give evidence of trends or punctual indicators that can be constantly monitored.
I hope this example can also be useful for monitoring other applications and any other object that exposes data in JSON.


Giuseppe Di Garbo
Consultant at Würth IT Italy
Hi everybody. I’m Giuseppe and I was born in Milan in 1979. Since the early years of university, I was attracted by the Open Source world and operating system GNU\Linux. After graduation I had the opportunity to participate in a project of a startup for the realization of an Internet Service Provider. Before joining Würth Phoenix (now Würth IT Italy) as SI consultant, I gained great experience as an IT consultant on projects related to business continuity and implementation of open source software compliant to ITIL processes of incident, change and service catalog management. My free time is completely dedicated to my wife and, as soon as possible, run away from Milan and his caotic time and trekking discover our beautiful mountain near Lecco for relax and lookup the (clean) sky.
Author
Latest posts by Giuseppe Di Garbo
19. 12. 2025
Atlassian, Service Management
Jira Service Management Customer Detail Fields: A Practical Use Case
29. 09. 2025
Atlassian, Service Management
Streamlining Service Request Management with ITIL4 and Jira Service Management
30. 06. 2025
Atlassian, Service Management
Creating Jira Service Management Requests from a Public Website? Here’s the Secure, No-API Way
28. 03. 2025
Atlassian, Service Management
Effortless On-Call Management with Jira Service Management