10. 07. 2026
APM, Log Management, Log-SIEM

19. 09. 2021
Rocco Pezzani
ITOA, NetEye, Unified Monitoring
Understanding Instability in a Monitored Environment
Whenever a new monitoring project gets underway, a consultant discusses with the customer about almost any related topic: what needs to be monitored, how to monitor it, when to implement it, how to represent performance data, etc. Based on customer needs and desires, any sort of implementation strategy can be planned, but almost all of these plans have one thing in common: other than a simple “Yes, it can be done”, no plan really cares about what, when, where, how and to whom a monitoring system will send its alerts.
This is not only because it’s a pain to identify the systems that needs to send notifications and the right people to receive them, but primarily because almost no customer really understands the way a monitoring system generates alerts. Why do I say this? Because for several years now, whenever I’m asked to implement and enable the notification system in NetEye, almost every customer says the same thing: “send me everything“. At these moments a very large, preemptive headache surges in my head: this is the easiest task to accomplish, but I know that sooner or later, those customers will start to tamper with the configuration either to disable or to filter out NetEye notifications. And I know that this will come back to haunt me with a jungle of wrong configurations I’ll have to fix.
The problem so far
Let’s turn back time and talk about the basics. Keeping it simple, NetEye (or Icinga2, if you prefer) sends notifications to alert the end user about a monitored object when a confirmed change in its state happens. To say that in more technical terms, when an object has a hard state change, a new process (not an OS process, but a logical one) begins to send alerts based on specific settings, and continues as long as the object’s state remains the same. This means that when a host goes from another state into UP, DOWN or UNKNOWN, when a service goes from another state into OK, WARNING, CRITICAL or UNKNOWN, or when a host or service flaps too often among the same set of states, then NetEye will potentially send one or more notifications. Leaving aside the matter of notification severity, service level, escalation and so on, this is what I want as the end user of a monitoring system. But this only works in a perfect world.
Almost every system administrator thinks their environment is quite stable, with no major issues or frequent fluctuations in important parameters. Therefore, he/she wants to be notified of everything because this way it’s possible to keep tabs on what’s happening. Obviously, when a major issue eventually occurs, he/she will be under a storm of notifications. But this is a reasonable price to pay, so why not enable all available notifications? Good point, but what happens if the monitoring system thinks the monitored environment is already undergoing a major issue or is very unstable? He/she will be flooded by notifications right from the beginning. Literally.
And this becomes all the more true as the number of monitored objects increases. Why? Because often thresholds will not be set right, or some objects won’t be monitored in the right way, or there is some other issue going on. Here’s a couple of my own personal experiences:
- While migrating the monitoring environment of a customer, some overloaded network devices were heavily monitored by the previous monitoring system; unaware of the overload status, while implementing a more detailed monitoring on a brand-new NetEye, those devices started to become unresponsive, sometimes responding to monitoring, sometimes not; each service had up to 3,000 state changes per week; so right after notifications were enabled, their mail boxes became full within seconds
- Another customer was unaware of a failing fan on a network device for months; this fan produced more than 50,000 state changes per week, and was responsible for flooding emails into the network group, which ignored the alert thinking it was a problem due to the new NetEye installation, and thus no one looked into the problem
These events really happened, and no one can really be blamed because in environments involving several hundred devices it’s difficult to pinpoint just by looking at the current state of hosts and services. People must be interviewed about it — but it’s still a filtered perception, so this option is not feasible. To have an unfiltered and real view, some statistics and other math must be run through before activating notifications.
How to find the instability of the monitored environment
As I always recommend, the first step is to remove all the UNKNOWNs and resolve as many problems as possible, where “resolve” doesn’t necessary mean “fix the remote system“, but can also mean “adjust the thresholds“, “fix the monitoring plugin” or even “temporarily deactivate monitoring“. This is a very good step to take, because it ensures NetEye only shows relevant data; and remember that it must be done continuously throughout the entire life of your monitoring system, whatever it is and whatever it takes It’s a necessary type of maintenance, but it’s for your own good.
The second step is to examine what your monitoring system has detected up until now, and I’m not talking about performance data, but about the history of events (state changes and so on). In NetEye this means “Open the Event Overview and see what it contains“. Yes, I know it can be a very troublesome job, but it’s the only way to understand if your environment is really healthy, or whether a cancer is hiding in the dark, waiting for notifications to be enabled so it can hit your mail boxes (and try your patience).
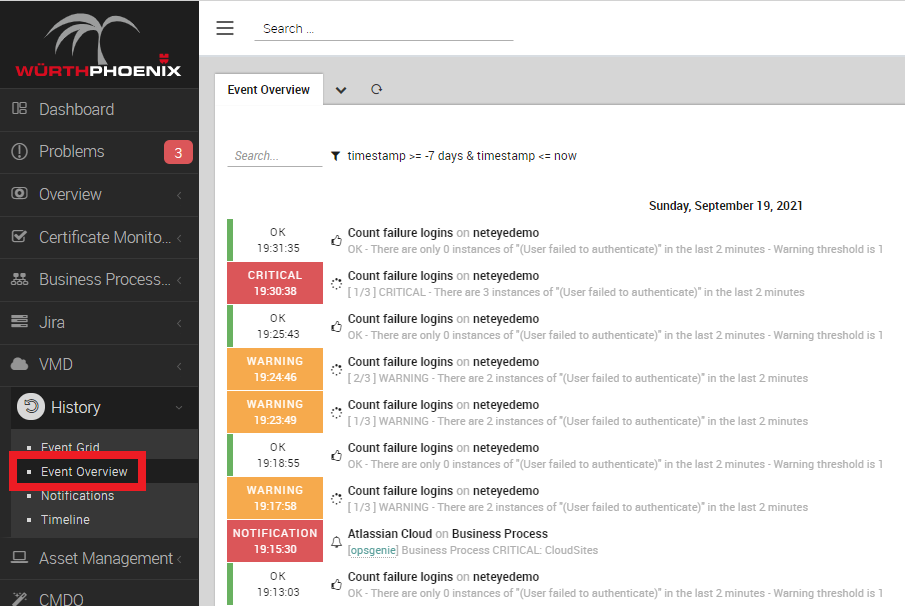
State and Notification History dashboard
As you already know, Event Overview can be very crowded. It can contain millions of events (yes, millions), and it can be quite troublesome to navigate through all of them. Doing some math on it can become quite an issue: only a person with good knowledge of both Icinga and SQL can pry out some interesting numbers. Since at Würth Phoenix we have both, we’ve tried to make your life a bit easier by designing a dashboard that can summarize data from Event Overview and show you how many state changes the monitored objects underwent and when.
And while we were at it, we also did some summary calculations on sent notifications. This way it’s possible to have a readable overview of what happened on your monitoring environment, who is notifying whom, and who has been notified. To view this dashboard, enter our NetEye Demo environment, open ITOA and pick “State and Notification History” from the list of available dashboards. If you don’t know the username and password to log in to the NetEye Demo environment, just follow this link.
This dashboard is divided into three sections, each one with a Time Line helping you understand changes over time. It also has a Pie Chart (to understand proportions of events) and Top Talker charts. Here you can set several parameters: inclusion of Hard/Soft states, selections of State transitions of interest, and Notification reasons of interest. The scope of the dashboard can be limited by the usual Date/Time picker, and on the Time Lines you can easilyzoom in to the time interval. All data has a minimum resolution of 1h (one hour).
State transitions
The first section of the dashboard, State transitions, is the most useful: it reports the count of the transitions Hosts/Services that occurred in the selected time window. Here you can:
- understand the normal level of activity of the monitored environment (how many state changes) and find anomaly periods with just a glance
- see the total transitions by type
- see the Top 10 hosts(only Host State, not counting its services) and services by number of state changes
The Top 10 is really useful: it’s possible to find the objects most subject to instability (state changes); this lets you easily identify the source of instability in your environment for a specific time period and take the appropriate actions to reduce their monitoring noise.
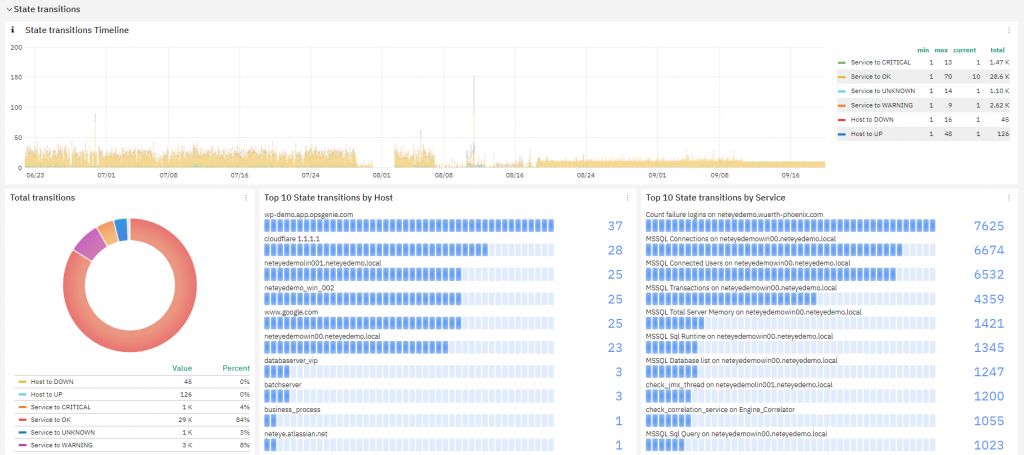
The most important function of the State Transitions section is to understand the level of stability in your monitored environment and improve it by identifying its worst source of instability. Going back to the start of this blog, given the fact that each state change can produce a notification, State Transitions gives you a rough estimate of the overall load all recipients will get if you activate all notifications.
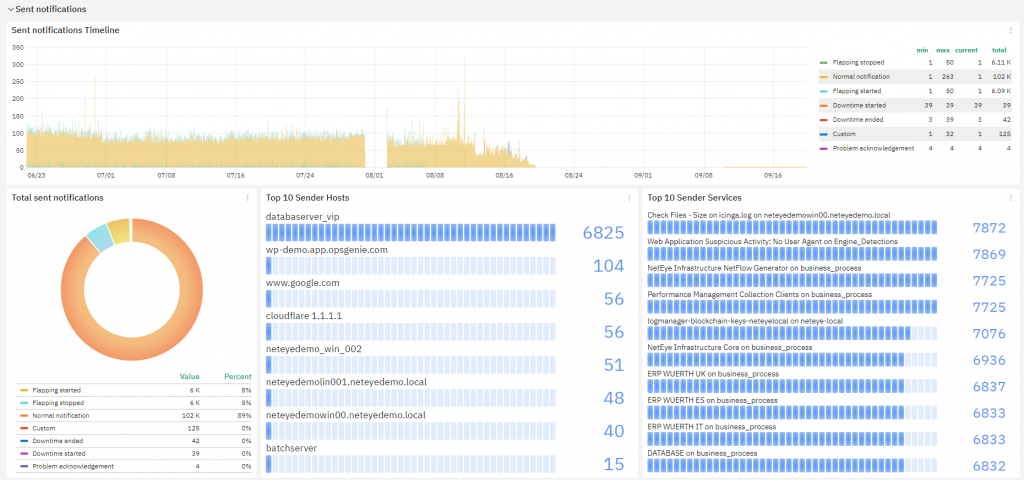
Sent notifications
The second section of the dashboard, Sent notifications, focuses on Notification creation. It lets you identify how many notifications have been generated and from which objects, helping you understand if the level of notification is too high and what systems generate them. Using this information it’s possible to decide if some systems needs to undergo fine notification tuning, or if it’s better to turn their notifications off.
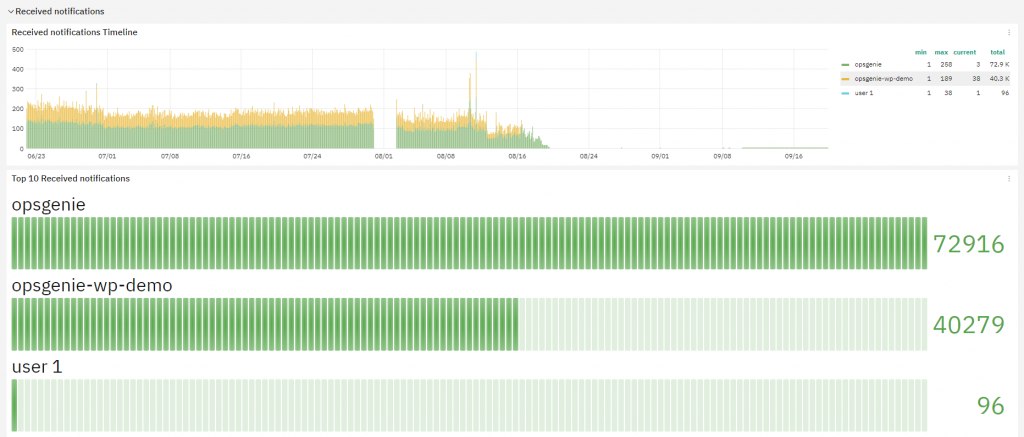
Received Notifications
The last section, Received Notifications, helps in understanding who received notifications and how many, telling you whether some user is getting too many. If you think this isn’t that useful, remember that too many notifications will hide the ones you should really be paying attention to, and can lead you to give them less importance than they really deserve.
How to install the State and Notification History dashboard
This dashboard is no secret at all, it’s freely available to all NetEye users. Also, all Icinga users can use it, but they will need to:
- Enable Icinga’s
ido-mysqlfeature and store data in a MySQL/MariaDB database (typically this is already done because it’s required by Icingaweb2) - Deploy a Grafana server that can reach the server where the Icinga IDO Database is saved and updated
Before downloading the dashboard, ensure Grafana has access to the Icinga IDO Database by creating a properly configured MySQL Data Source. The procedure isn’t that difficult:
- Access the DBMS and create a user having
SELECTprivileges on the Icinga IDO Database - Add a new MySQL Data Source to Grafana that connects to the DBMS using the user created in step #1
On NetEye, this is pretty easy: this brief script can create the Data Source fo ryou. Just remember to set a proper password in the MYSQL_PASSWORD variable. The Data Source name is icinga-mysql.
MYSQL_USERNAME='icingareadonly'
MYSQL_PASSWORD='<Change Me!>'

. /usr/share/neteye/scripts/rpm-functions.sh
. /usr/share/neteye/secure_install/functions.sh
. /usr/share/neteye/grafana/scripts/grafana_autosetup_functions.sh

cat << EOF | mysql
CREATE USER '${MYSQL_USERNAME}'@'%' IDENTIFIED BY '${MYSQL_PASSWORD}';
CREATE USER '${MYSQL_USERNAME}'@'localhost' IDENTIFIED BY '${MYSQL_PASSWORD}';
GRANT SELECT ON icinga.* TO '${MYSQL_USERNAME}'@'%';
GRANT SELECT ON icinga.* TO '${MYSQL_USERNAME}'@'localhost';
FLUSH PRIVILEGES;
EOF

datasource="icinga-mysql"
datasource_type='mysql'
mysql_host="mariadb.neteyelocal"
mysql_port=3306
db_name="icinga"
grafana_host="grafana.neteyelocal"

datasource_data='"name":"'${datasource}'","type":"'${datasource_type}'","host":"'${mysql_host}':'${mysql_port}'","access":"proxy","database":"'${db_name}'","user":"'${MYSQL_USERNAME}'","password":"'${MYSQL_PASSWORD}'"'
create_datasource "${datasource}" "${datasource_data}" "${grafana_host}"
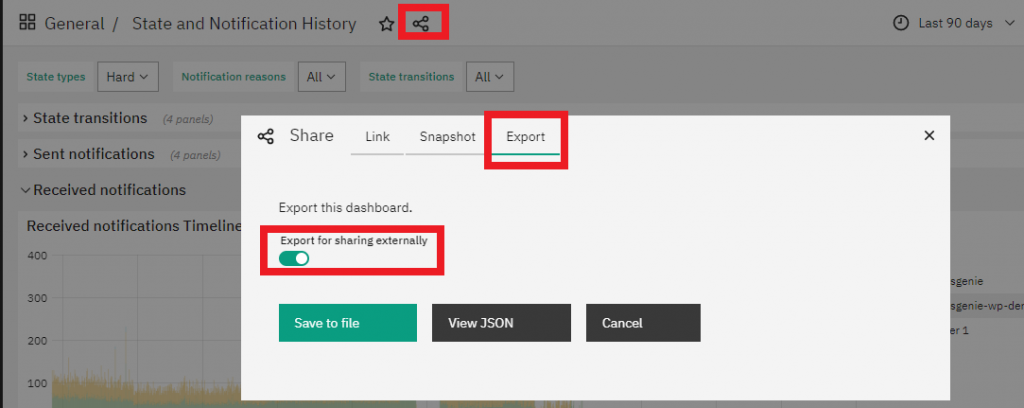
Now you can freely export the dashboard from our NetEye Demo environment: just access the Dashboard, click on Share dashboard or panel link and select the Export tab. Next, choose the format for your link after selecting Export for sharing externally. I usually use the View JSON button because I can directly copy and paste the dashboard’s code, but also Save to file will work fine.
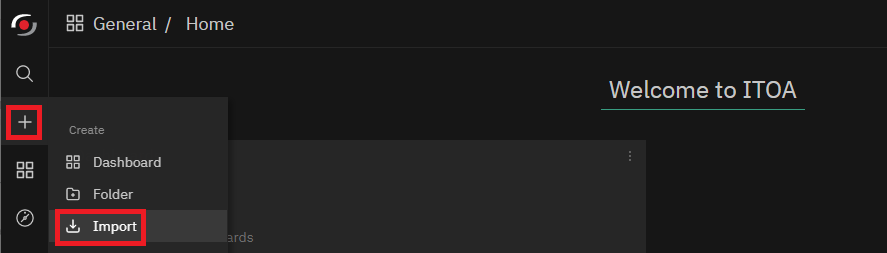
Next, you can go to your own NetEye’s ITOA (or your own Grafana) and Import the new dashboard.
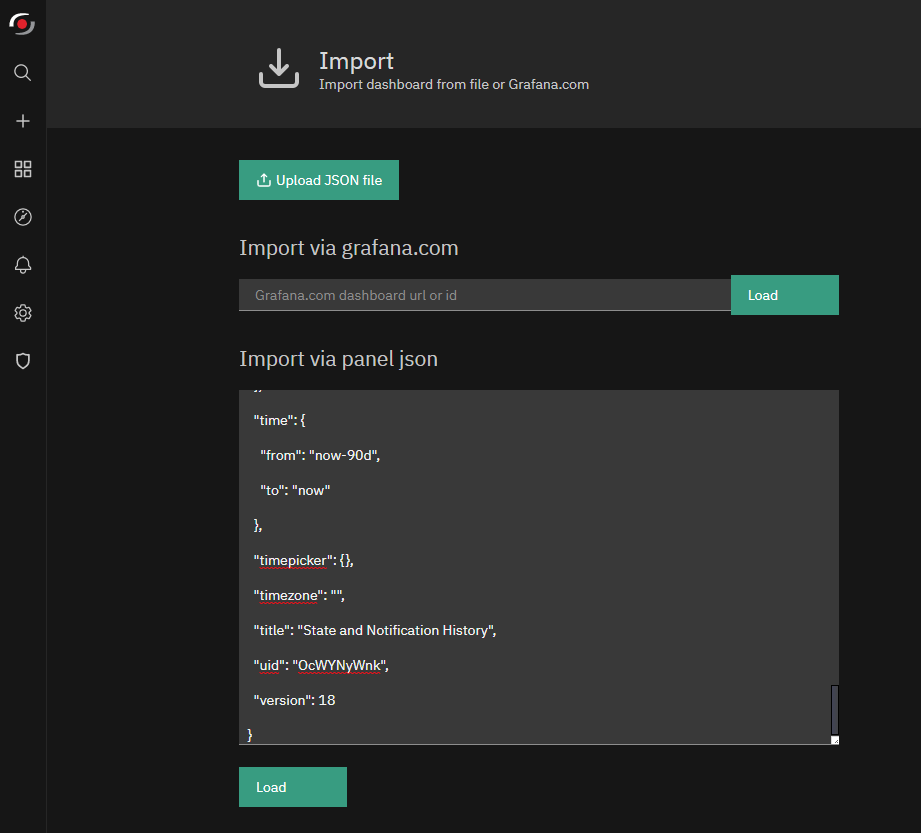
Based on how the dashboard was previously exported, select Upload JSON file or directly paste the dashboard’s JSON data.
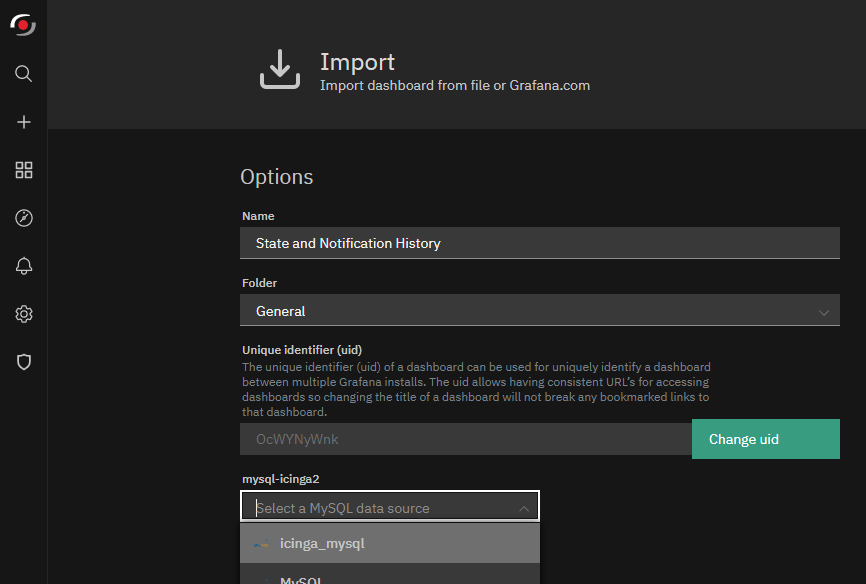
Don’t forget to select the Data Source created before to allow the dashboard to access the Icinga IDO data.
And last, just one note: this dashboard performs queries on some database tables that can become quite large, therefore it’s pretty normal for it to take some time when loading data. To shorten the load time, just reduce the time window to an acceptable value.
Author
Latest posts by Rocco Pezzani
22. 05. 2026
NetEye, NetEye Extension Packs
NEP and Upgrading to NetEye 4.48
18. 03. 2025
Icinga Web 2, ITOA, NetEye, UI, Unified Monitoring
A First Step towards Multitenancy in Icinga 2
31. 12. 2024
Business Service Monitoring, ITOA, NetEye, SLM, Unified Monitoring
Display a Service’s Availability with ITOA
30. 11. 2024
Business Service Monitoring, NetEye, Unified Monitoring
The Story of a Strange Business Process