06. 05. 2024
Unified Monitoring

05. 10. 2021
Giovanni Davide Saccá
NetEye, Unified Monitoring
nProbe and nTop All-in-One (Single Node): Netflows Analysis
One of my clients with a number of routers installed at their own remote location asked me if I could analyze the network flows at multiple locations.
Their network architecture is a full mesh, and thus has private subnetworks, data center environments, and even in some cases cloud providers.
Complex architectures like this require increasing levels of monitoring of traffic flows that crisscross the network, looking for details as deep as Layer 7 of the ISO/OSI stack in order to observe the most widely used protocols, the hosts as their IP address involved in the communication, and the “Top Talkers” about them.
This client preferred a solution based on nProbe/nTop, with NetEye serving as a point of consolidation and analysis console for the collected data.
The scenario assumed that no software components should be installed at the remote locations, to minimize on-site configuration and maintenance, and thus we decided to use nProbe/nTop All-in-One, both installed on NetEye 4 located in D.C.
We therefore asked for assistance from connectivity providers in order to ensure that every remote router included the correct configuration for either Netflow, Sflow, or IPfix, as well as the formats that nProbe/nTop supports, in order to analyze network traffic.
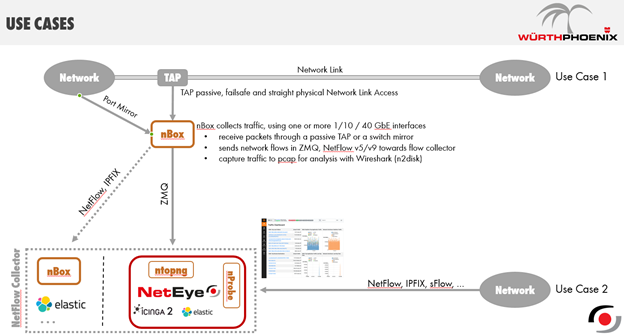
Next, I’d like to show you how our solutions are installable in a customer environment with 2 use cases, where given my client’s needs we’ve applied the solution described below to Use Case #2:
The second step involves the preparation of the NetEye4 environment and the correct configuration of the respective files nprobe.conf and ntopng.conf so that nProbe could begin receiving and processing the Netflow data sent from the network devices; and nTop could start collecting data arriving from nProbe, in order to let an administrator check and analyze it, through the WEB GUI.
Once we finished the design and implementation based on the second use case, we turned to configuring the nTop’s WEB GUI, letting it discover the extent of our network, such as the allocation of IP classes divided over each individual remote location that comprised the client’s network.
One of the first things we noticed X was configuring the Traffic Profiles contained in Menu Settings -> Traffic Profiles:
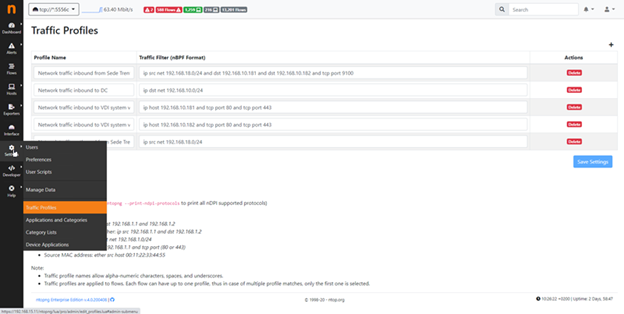
Thanks to the BPF syntax you can instruct nTop about the inside of the traffic flow being analyzed, and extrapolate the information that matches your filter for protocol and CIDR, for instance:
Network Traffic Inbound to DC = ip dst net 192.168.10.0/24
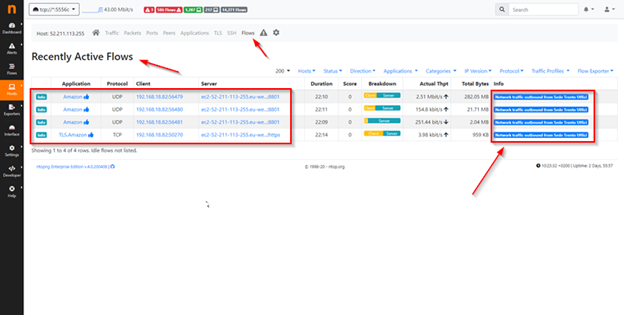
This will allow you to use Menu Flow to read specific information regarding the IP network class indicated in the BPF syntax, simply pointing on the Column Info as you can see in this example:
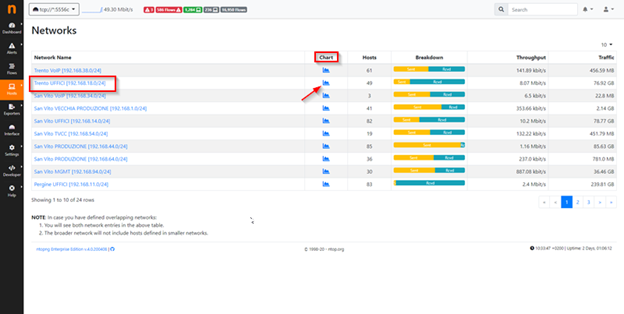
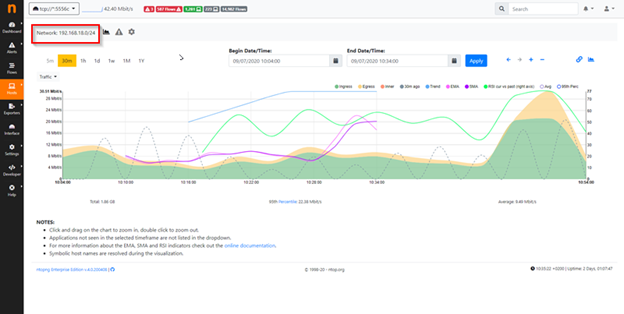
At Menu Host -> Network instead you can for instance declare the IP classes which compose your network, and nTop lets you analyze the IP class declared in order to check of amount of bandwidth utilization, number of hosts belong to the IP class take in analysis, breakdown of traffic to recognize and compare traffic sent and received, throughput of traffic and so on, for example:
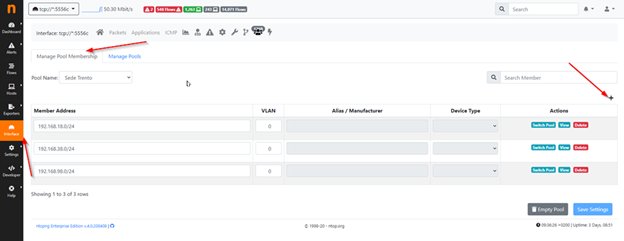
Similarly, after configuration you can use Pool Membership, which lets you declare and configure each network allocated to individual remote locations:
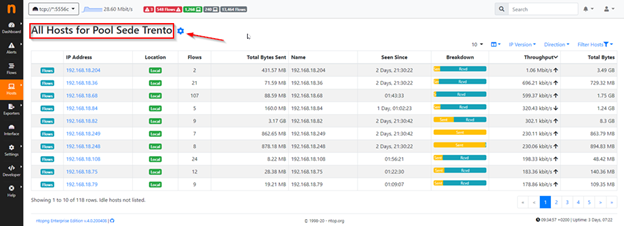
And to have a way to analyze just the data from a single Pool:
The analyses we’ve conducted up to now are possible thanks to Netflow, a recognized standard since 1996, which allows you to collect flows contained within network traffic.
Analyzing the data provided by Netflow, a network administrator can locate the source and destination of traffic, the service class, and the causes of any network congestion.
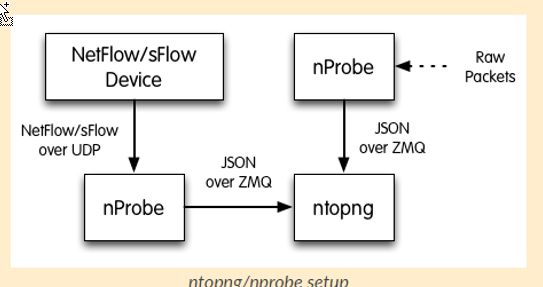
A typical monitoring architecture for flow that uses Netflow, consists of three main components:
- Flow Exporter, which aggregates the packets moving within the target network and exports them to a collector, typically it’s a network device able to send NetFlow or sFlow.
- Flow Collector, which receives, saves and pre-processes the flow data received from the Flow Exporter, in our case it’s nProbe.
- Analysis Application, which analyzes the collected data so it can be profiled, in our case it’s nTopng
The diagram below shows the relationships between these three components:
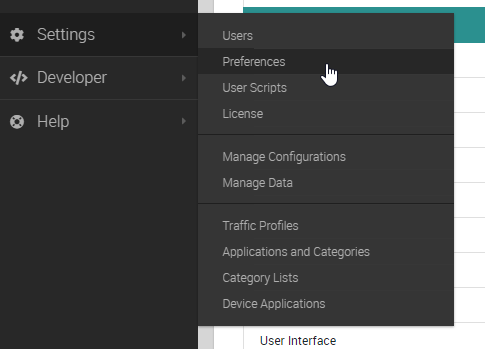
Finally I will briefly pass a suggestion about how to store data in nTop advising you to store Timeseries in Influxdb to performance reason, in terms of configuration, thanks to the nTop WEB GUI go to Menu Settings -> Preferences:
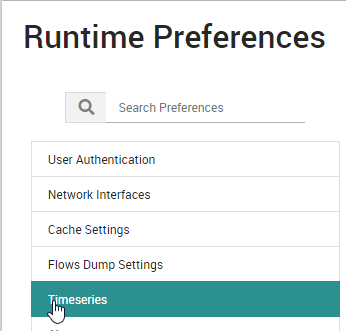
and Under Runtime Preferences select Timeseries:
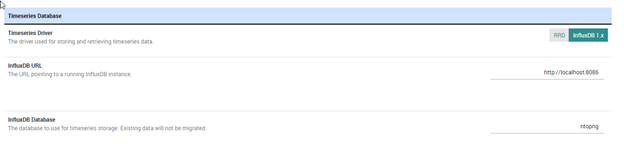
Here you can configure InfluxDB as a backend:
This tool lets you take into account various network scenarios where nProbe and nTop can offer solutions even in strictly segmented network environments.
It’s not random chance in fact that I often get requests for nProbe configuration that’s distributed over multiple NetEye satellites, which pre-process Netflow data and then forward it to the NetEye master.
Giovanni Davide Saccá
Hi all, my name is Davide and I was born in San Donato Milanese. Since I was a boy I've always been intrigued by PCs, and so I took my first steps with my Commodore VIC-20. Before joining Würth Phoenix as an SI consultant, I worked first as a Network Engineer for several ISPs (Internet Service Providers) in the late 90s, then for the first ASP (Application Service Provider) and next as a head of IT Network and Security. My various ITIL and Vendor certifications have allowed me to be able to cooperate at multiple project levels. I like tennis, music, motorcycles and going on nature walks with my family.
Author
Latest posts by Giovanni Davide Saccá
15. 02. 2023
Unified Monitoring
NetEye GeoMap Module
15. 02. 2023
Unified Monitoring
Ntopng and Behavior Analysis
15. 02. 2023
NetEye, Unified Monitoring
Grafana: InfluxDB Query to Extract More Than a Single Metric in a Single Panel