
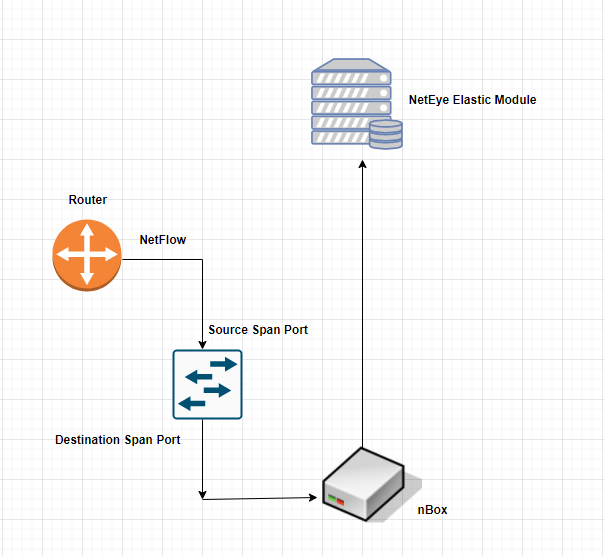
A customer asked me to analyze their network flows, with a solution oriented towards using an nBox that collects NetFlow data from a router located away from the branch office, takes it in for analysis, and then sends it to a NetEye Elastic module, which act as an analysis console for that NetFlow data.
The first step involves choosing how to use the nBox, i.e., whether it should receive traffic on a dedicated socket, and where the correct configuration of the nprobe.conf file would thus have the directive:
[–c=6363]
or whether the nBox should receive traffic through a Span Port or Mirror Port, configured on board a network device such as a switch; in this case the correct configuration of the nprobe.conf file is with the directive:
[-i=nBox_physical_interface_destination_of_the_Span_Port].
In the use case under consideration, it was decided to use a Span Port, specifically to configure it as a switch, which physically connected the router port (whose NetFlow is to be analyzed) to the nBox port.
Consider the minimum network needs in terms of the physical layer, looking at the following diagram:
If the router and nBox cannot connect on the same switch, it may be useful configure a remote span port on your Layer2 Network Schema, from the switch where the router is plugged in and the switch where the nBox is plugged in, or it may be more comfortable using a TAP device: the nBox can operate in both cases.
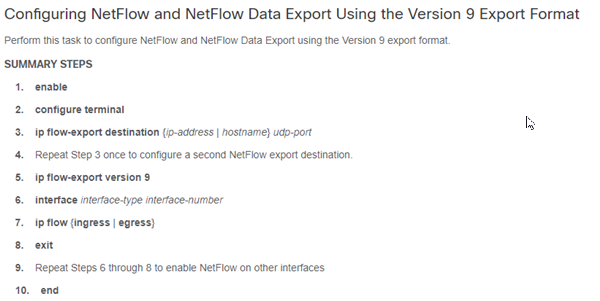
In case you’d like the details and instructions for configuring NetFlow on a Cisco router, I’ve put here the CLI of a Cisco entry level device:
If you’d like details and guidance on how to configure the span port on a Cisco switch for example, do a search with the keywords Configuration Guide and Span Port.
Once the necessary wiring has been completed and the router and switch have been configured, it’s time to configure the nBox to send the NetFlow data received.
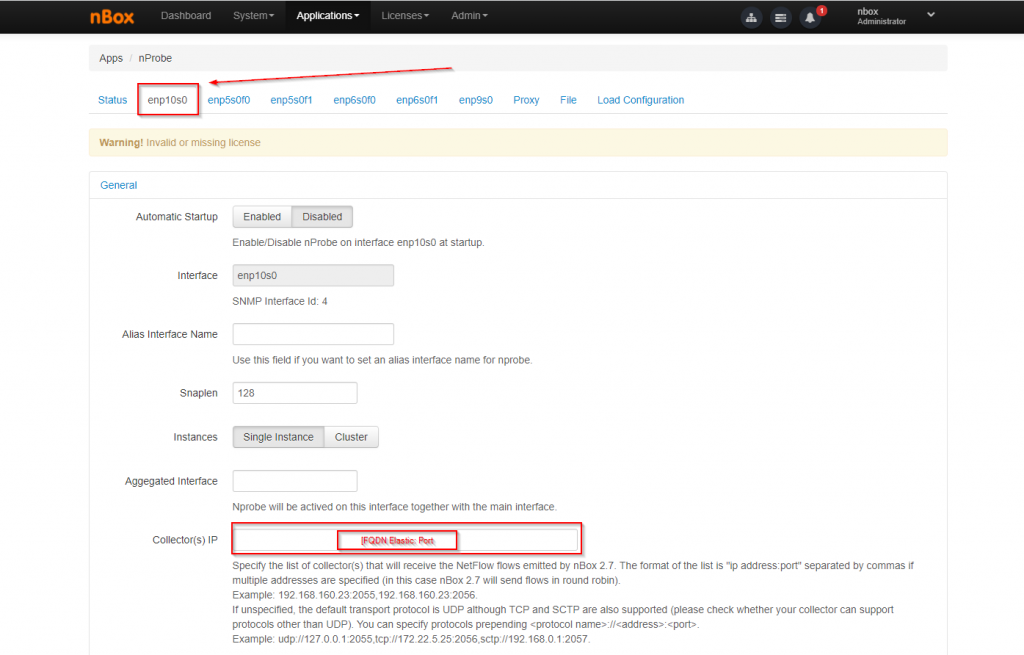
Proceed from the nBox Web GUI by selecting the Menu Application > nProbe.
Set the nProbe interface connected to the switch to ON,

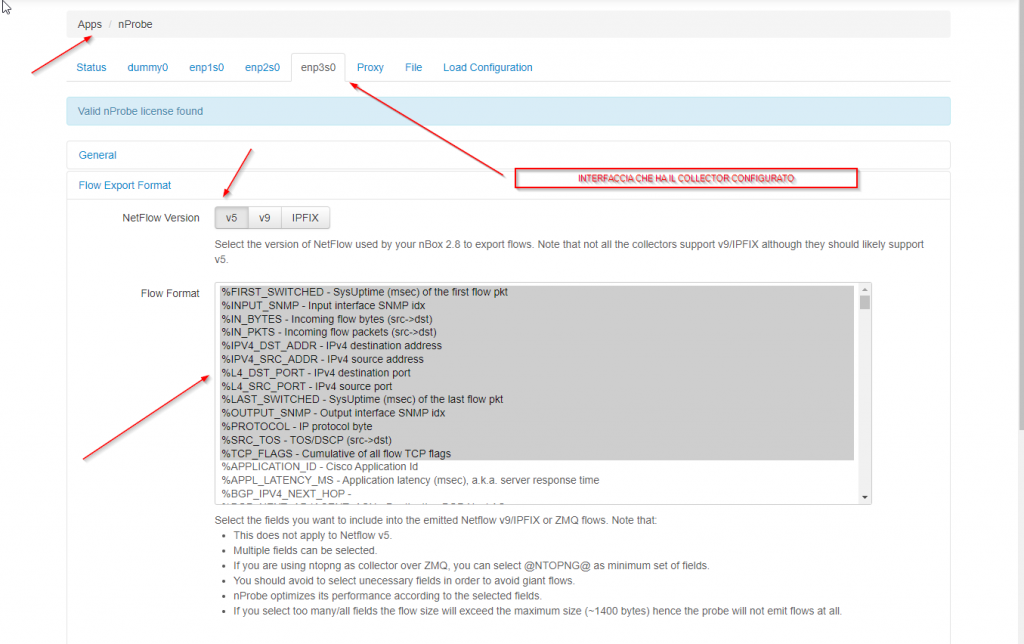
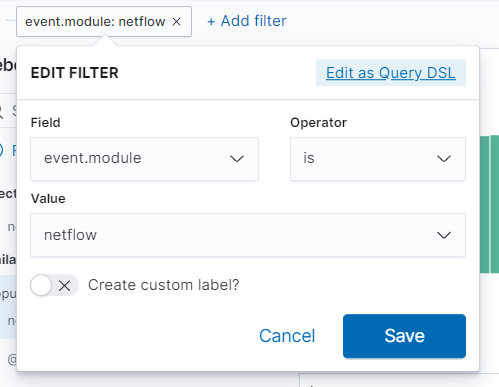
Then configure the FQDN and port where Elastic is listening. The default port is 2055, as shown in the following screenshot:


Giovanni Davide Saccá
Hi all, my name is Davide and I was born in San Donato Milanese. Since I was a boy I've always been intrigued by PCs, and so I took my first steps with my Commodore VIC-20. Before joining Würth Phoenix as an SI consultant, I worked first as a Network Engineer for several ISPs (Internet Service Providers) in the late 90s, then for the first ASP (Application Service Provider) and next as a head of IT Network and Security. My various ITIL and Vendor certifications have allowed me to be able to cooperate at multiple project levels. I like tennis, music, motorcycles and going on nature walks with my family.
Author
Latest posts by Giovanni Davide Saccá
15. 02. 2023
Unified Monitoring
NetEye GeoMap Module
15. 02. 2023
Unified Monitoring
Ntopng and Behavior Analysis
15. 02. 2023
NetEye, Unified Monitoring
Grafana: InfluxDB Query to Extract More Than a Single Metric in a Single Panel