


28. 10. 2025
ITOA, NetEye, Unified Monitoring

13. 06. 2022
Giovanni Davide Saccá
ITOA, NetEye, Unified Monitoring
Grafana for nTop: Realizing a Dashboard
A customer with a NetEye installation to which I had added the nTop module asked me if I could integrate nTop’s Grafana Dashboards, so they could view them by consulting NetEye’s ITOA Menu.
The installation and configuration of nTop for this client, a task I had already conducted some time ago, was a matter of analyzing what nTop performance data was available from InfluxDB. Then I would only need to extract that data to make Grafana Dashboards to propose to the client.
The first configuration I added was to export nTop time series data to InfluxDB, which involved creating the DB and nTop user on the DB Server.
The second useful configuration was to instruct nTop to save the time series data in InfluxDB by configuring all of its DB Server connection parameters.
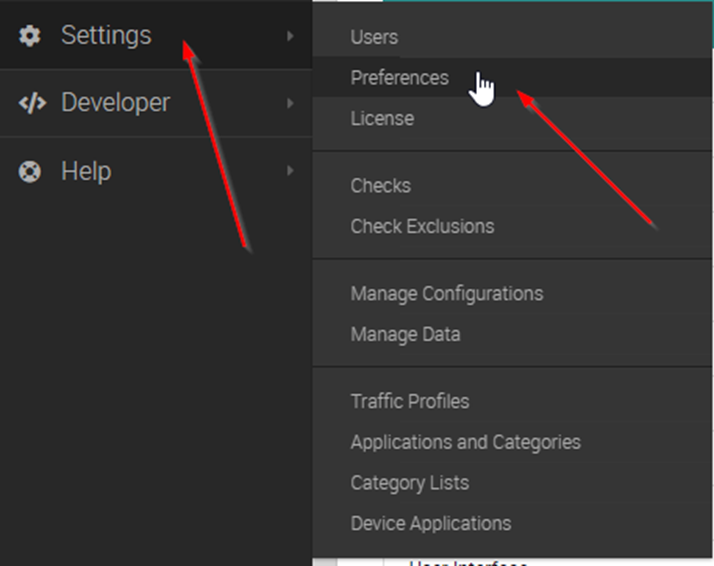
To proceed, consult the menu Settings -> Preferences:
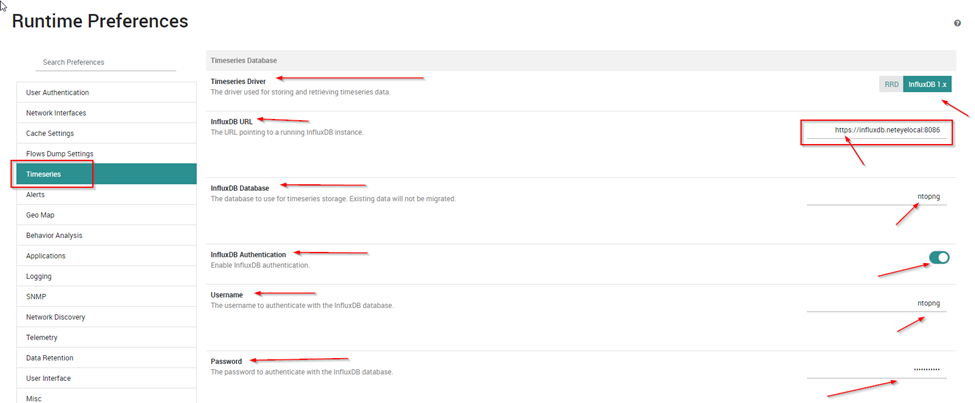
Note, in terms of data security, how nTop communicates with InfluxDB via the HTTPS protocol.
Now it’s time to configure Grafana and give it the details of the Data Source it should use:
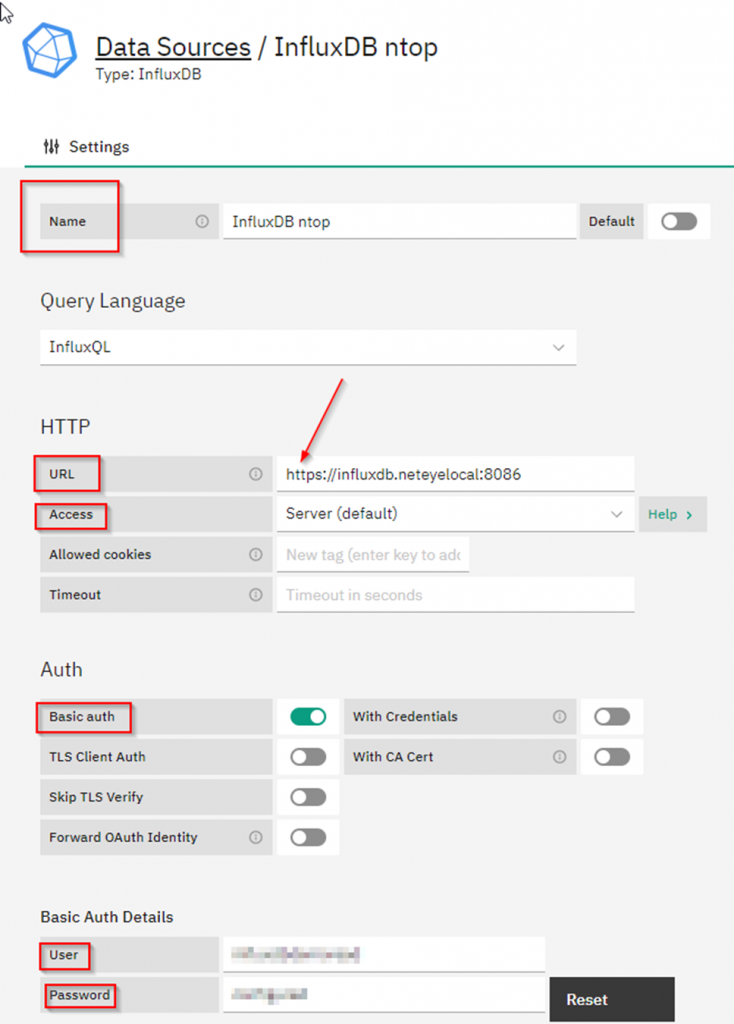
It’s a requirement that the same DB connection parameters configured for nTop are also passed to Grafana.
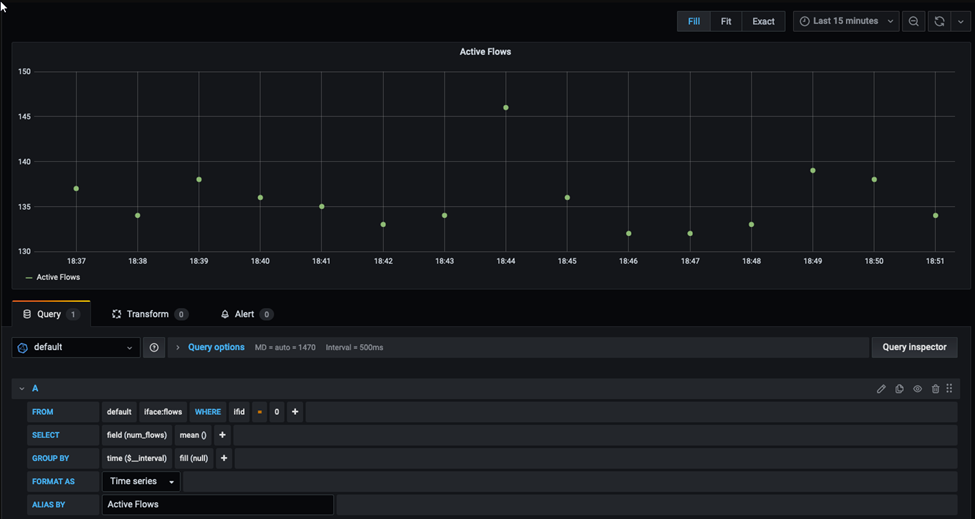
The last step is to add an nTop Dashboard to Grafana. To do this we make use of the query builder that Grafana provides, so that we have help in constructing a query useful for extracting time series data from the database when we generate our Dashboard:
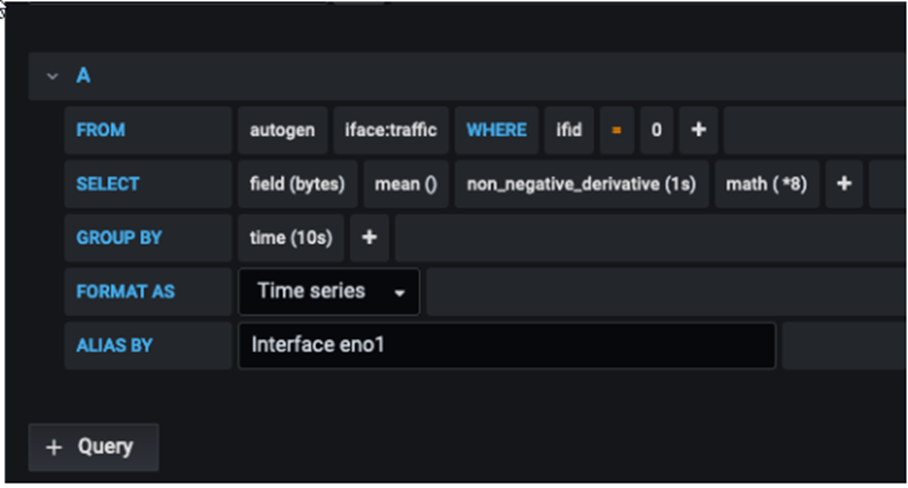
Queries change depending on whether you then want to represent the data with a Gauge or a Counter.
The gauges are meant for values such as Active Flows or Bandwidth, hence you see in the SELECT the need to use the derivative, while the counter is better suited to representing incremental values that can be taken as-is:
These Solutions are Engineered by Humans
Are you passionate about performance metrics or other modern IT challenges? Do you have the experience to drive solutions like the one above? Our customers often present us with problems that need customized solutions. In fact, we’re currently hiring for roles like this as well as other roles here at Würth Phoenix.
Giovanni Davide Saccá
Hi all, my name is Davide and I was born in San Donato Milanese. Since I was a boy I've always been intrigued by PCs, and so I took my first steps with my Commodore VIC-20. Before joining Würth Phoenix as an SI consultant, I worked first as a Network Engineer for several ISPs (Internet Service Providers) in the late 90s, then for the first ASP (Application Service Provider) and next as a head of IT Network and Security. My various ITIL and Vendor certifications have allowed me to be able to cooperate at multiple project levels. I like tennis, music, motorcycles and going on nature walks with my family.
Author
Latest posts by Giovanni Davide Saccá
15. 02. 2023
Unified Monitoring
NetEye GeoMap Module
15. 02. 2023
Unified Monitoring
Ntopng and Behavior Analysis
15. 02. 2023
NetEye, Unified Monitoring
Grafana: InfluxDB Query to Extract More Than a Single Metric in a Single Panel