15. 06. 2026
NetEye, Unified Monitoring

Some time ago, a customer asked me if it was possible to export the data used by NetEye 4 Performance Graphs to CSV format. In particular, the performance graphs that are displayed within Icinga 2’s web interface currently have no option to export their data.
After some research, I found that the only way to perform this type of operation is to use the ITOA module (more commonly known as Grafana).
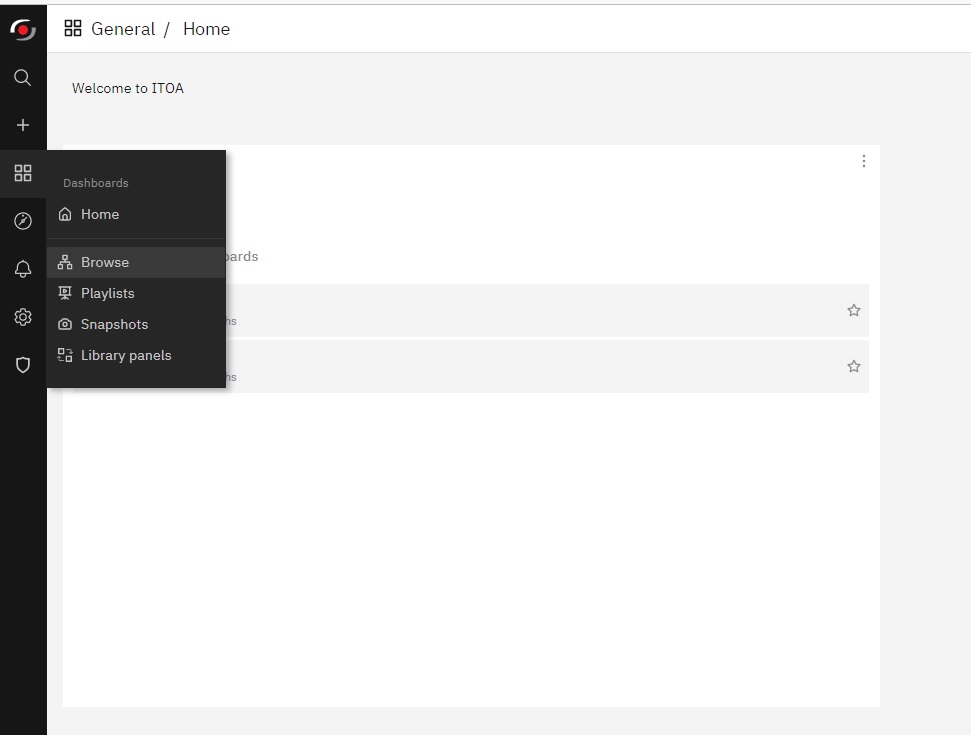
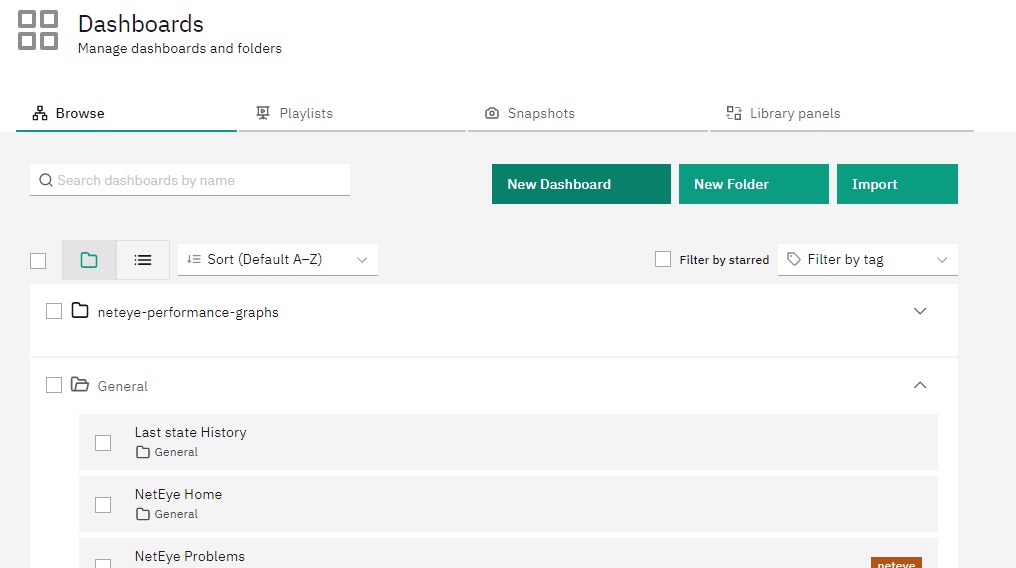
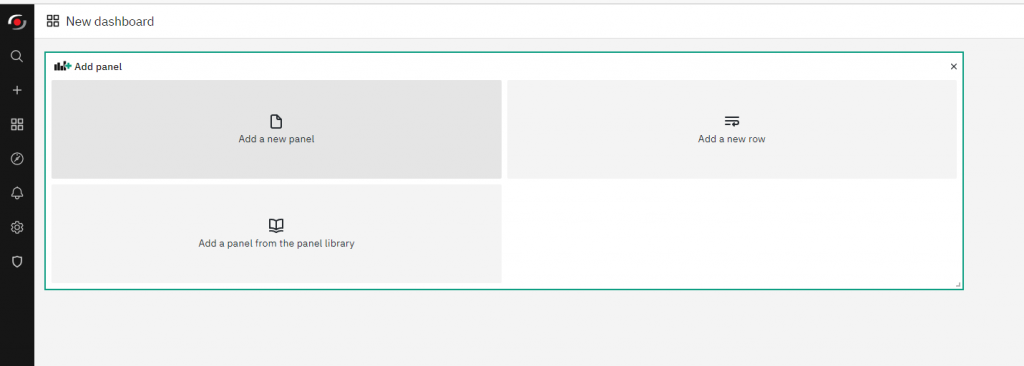
First of all, we need to create a new Dashboard with the graph that we will use to achieve our goal. From the ITOA “General” menu item, go to “Browse”, select “New Dashboard” and then “Add a New Panel”.
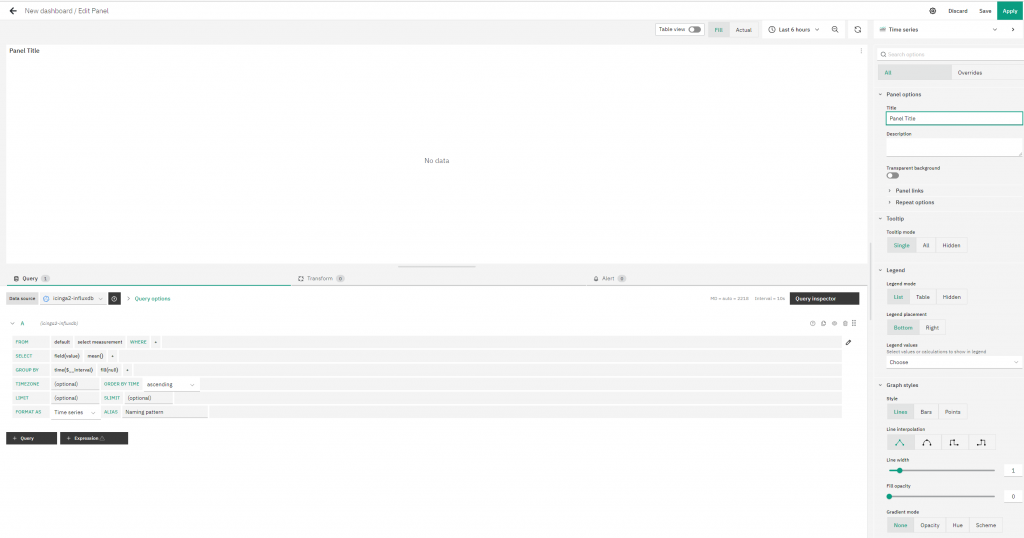
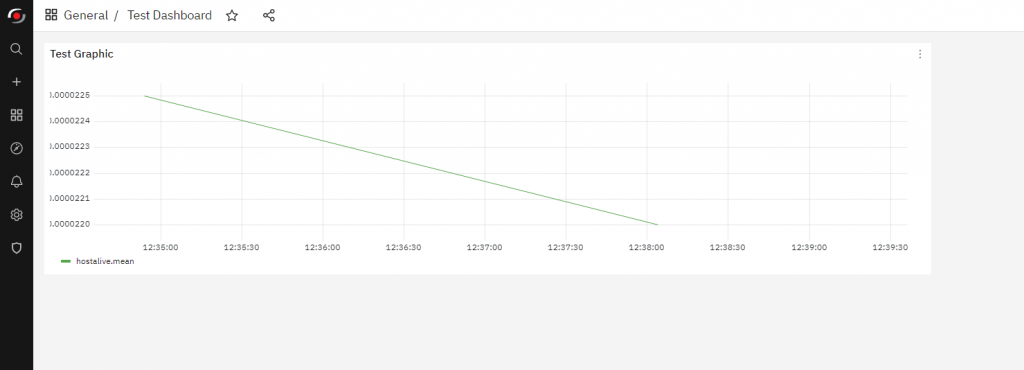
We can now generate the graph according to the metrics we are interested in, and save it within our new Dashboard.
In this example, I won’t go into the details of how Grafana is used to generate graphs, I’ll just refer to performance data generated by a simple ping command.
Once generated and saved, the graph will appear within our previously created Dashboard.
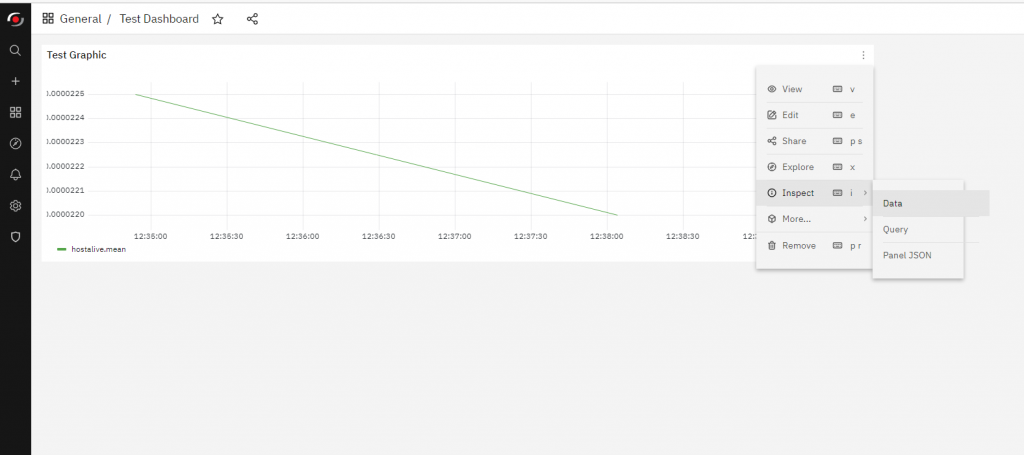
Now simply click on the graph menu represented by the three dots at the top right, go to the menu item ‘Inspect’ and then ‘Data’.
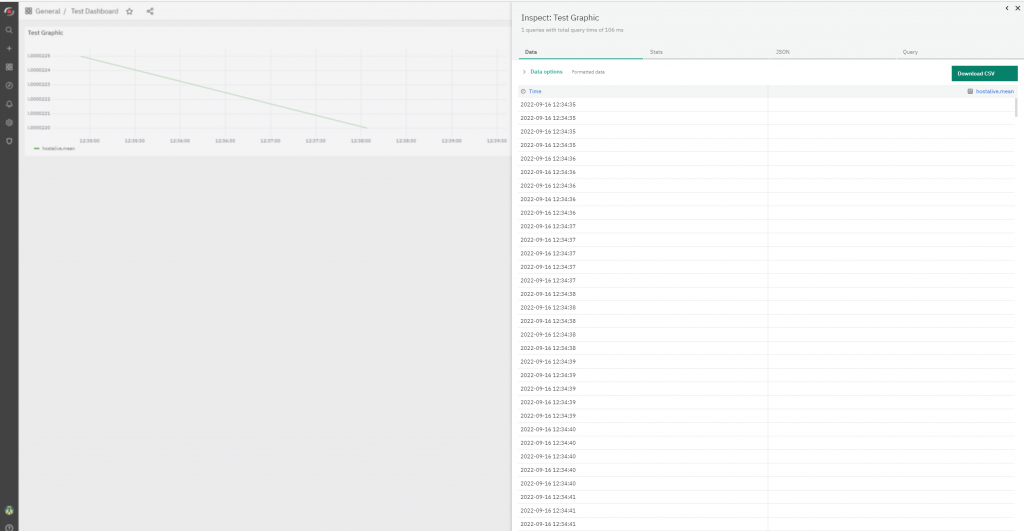
The window that appears will contain the data (in table format) that makes up our graph.
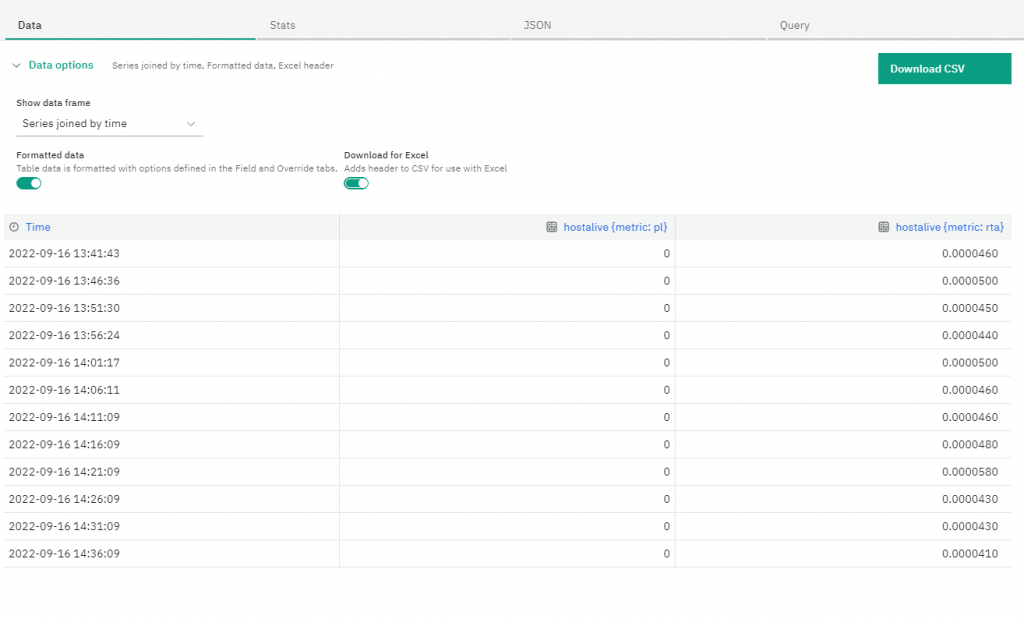
The first action to take is to expand the advanced “Data options” menu. Here we can choose whether to export our data in CSV format that’s compatible with applications like Microsoft Excel, after which we can click on the “Download CSV” button to achieve our goal.
These Solutions are Engineered by Humans
Did you find this article interesting? Does it match your skill set? Our customers often present us with problems that need customized solutions. In fact, we’re currently hiring for roles just like this and other roles here at Würth Phoenix.
Andrea Mariani
Author
Latest posts by Andrea Mariani
21. 03. 2026
AI
Reflections on Running LLMs Locally: Why It’s Worth Running Them on Your Own Infrastructure
11. 09. 2025
NetEye, PHP, Unified Monitoring
Using Keycloak to Secure Web Pages and Virtual Directories
20. 06. 2025
NetEye, Unified Monitoring
NEP Telegram Notification