
06. 07. 2021
Lorenzo Candeago
ITOA
Continuous Deployment for Grafana Dashboards using Jsonnet and Jenkins, Part 2
In my previous blog post, I introduced our scenario: in a private cloud context, we want to deploy a dashboard for multiple clients created using Grafana, InfluxDB and Telegraf for SQL performance monitoring. We saw how to write a Grafana dashboard programmatically using Jsonnet and upload it to Grafana using the Grafana API.
In this post we’ll focus on Continuous Deployment (CD), where we want to be able to deploy the dashboard for all of our clients automatically each time the git repository containing the dashboard template is updated.
Jenkins, git and Multi-organization Grafana Continuous Deployment
In my previous blog post, I introduced our scenario: in a private cloud context, we want to deploy a dashboard for multiple clients created using Grafana, InfluxDB and Telegraf for SQL performance monitoring. We saw how to write a Grafana dashboard programmatically using Jsonnet and upload it to Grafana using the Grafana API.
In this post we’ll focus on Continuous Deployment (CD), where we want to be able to deploy the dashboard for all of our clients automatically each time the git repository containing the dashboard template is updated.
Each client has its own Grafana Organization or even its own Grafana instance. What we want to do is to regularly poll the git repository where the Jsonnet files of the dashboard is located (e.g. each workday at 8 pm) to check for new updates. If there are, we want to parametrize the Jsonnet source file of the dashboard so that each client gets a personalized version of the dashboard, compile the Jsonnet file to JSON, and finally upload it to Grafana. In this blog post we’ll see how to achieve this by using git, Jsonnet, Jenkins and the Grafana API.
A Toy Environment for Testing
(If you already have a working instance of Jenkins and Grafana, you can skip this section.)
For easier reproducibility while testing, we show the steps we used to run a simple Jenkins and Grafana configuration using Docker. Please note that this is a toy example, and for real-world Jenkins and Grafana usage some more care is required from a security and configuration point of view.
First, let’s set up our environment: we’ll use Docker and add a Jenkins container and a Grafana container on the same network. We’ll use the Alpine Linux version of the Jenkins container because it ships a recent version of curl that we will need later on.
We start by creating a bridge network called jenkins and running a Jenkins container
$ docker network create --driver bridge jenkins
$ docker run --name jenkins --rm -d --network jenkins --publish 8080:8080 jenkins/jenkins:alpine
and then on the same network, we can deploy a Grafana container:
$ docker run --name grafana -e "GF_SERVER_HTTP_PORT=3000" -d --publish 3000:3000 --network jenkins grafana/grafanaBy using a bridge network, the containers can resolve each other by name, so from the jenkins container, the Grafana endpoint can be reached at http://grafana:3000/.
Next we’ll create a file server mockup that we can use to download binaries that we want to distribute in our Jenkins pipeline, specifically the Jsonnet binary.
In real-life scenarios, you can use binary versioning repositories such as Pulp or Nexus for this.
Let’s start by creating a simple Dockerfile based on Alpine Linux that compiles Jsonnet and makes the Jsonnet binary available through a basic webserver:
FROM alpine:latest
RUN mkdir -p /file_server
RUN apk add --update --no-cache python3 go
RUN  GOBIN=/file_server go get github.com/google/go-jsonnet/cmd/jsonnet
WORKDIR /file_server
ENTRYPOINT ["python3","-m", "http.server"]
After saving the Dockerfile we can build the container and run it:
$ docker build --no-cache -t alpine/file_server Dockerfile
$ docker run -it --name file_server --rm -d --network jenkins --publish 8000:8000 alpine/file_server
Our network should now look like this:
$ docker ps
6e9f79a1a0b1   jenkins/jenkins:alpine   "/sbin/tini -- /usr/…"   5 seconds ago    Up 5 seconds    0.0.0.0:8080->8080/tcp, :::8080->8080/tcp, 50000/tcp   jenkins
3ae09218f748   grafana/grafana          "/run.sh"                3 minutes ago    Up 3 minutes    0.0.0.0:3000->3000/tcp, :::3000->3000/tcp              grafana
1c4842422c3d   alpine/file_server       "python3 -m http.ser…"   14 minutes ago   Up 14 minutes   0.0.0.0:8000->8000/tcp, :::8000->8000/tcp              file_server
So now we can log in to Jenkins at https://localhost:8080 and proceed with the default setup. To retrieve the admin password we need to log in to the Jenkins container and read it from /var/jenkins_home/secrets/initialAdminPassword :
$ docker exec -it jenkins /bin/bash
$ cat /var/jenkins_home/secrets/initialAdminPassword
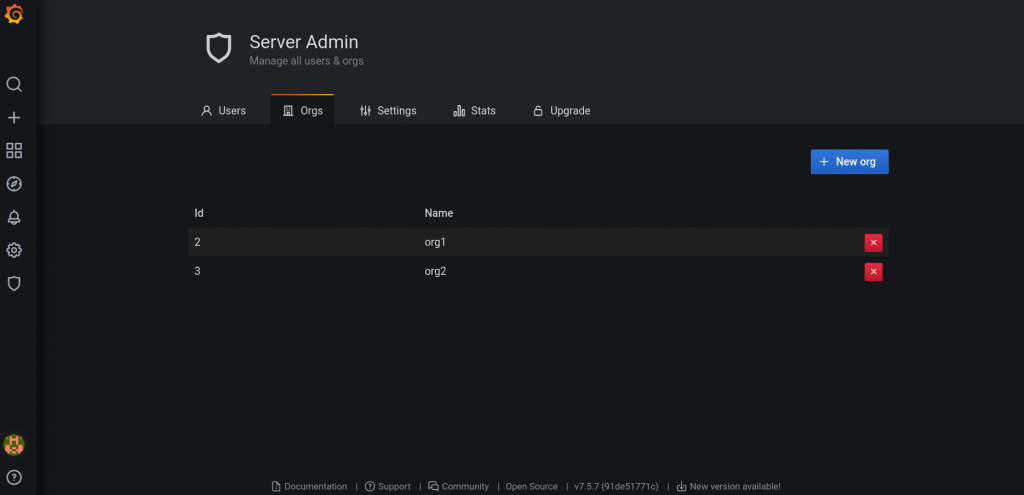
62a3b8b2647b4e6aa50d8af341dc22d8For this toy example we will then add two organizations to our Grafana instance: org1 and org2
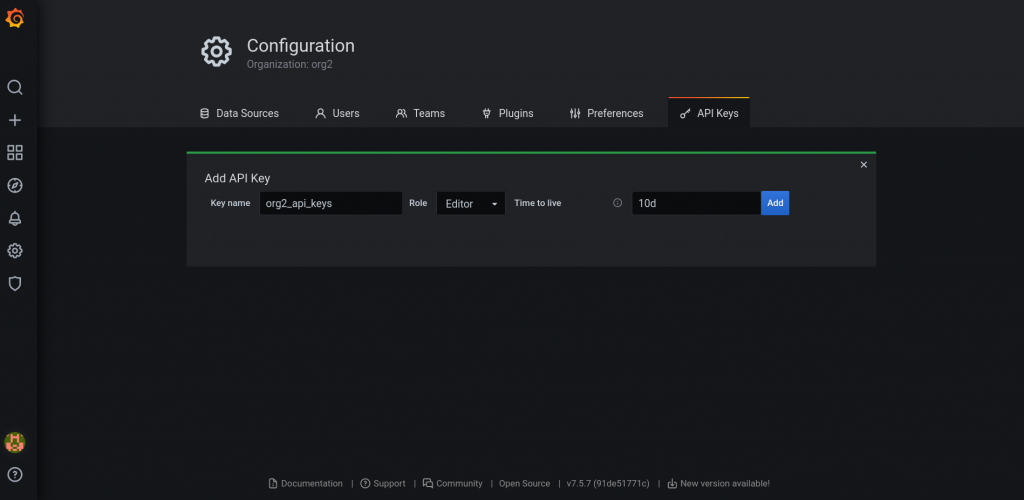
then create a Grafana API token for each org:
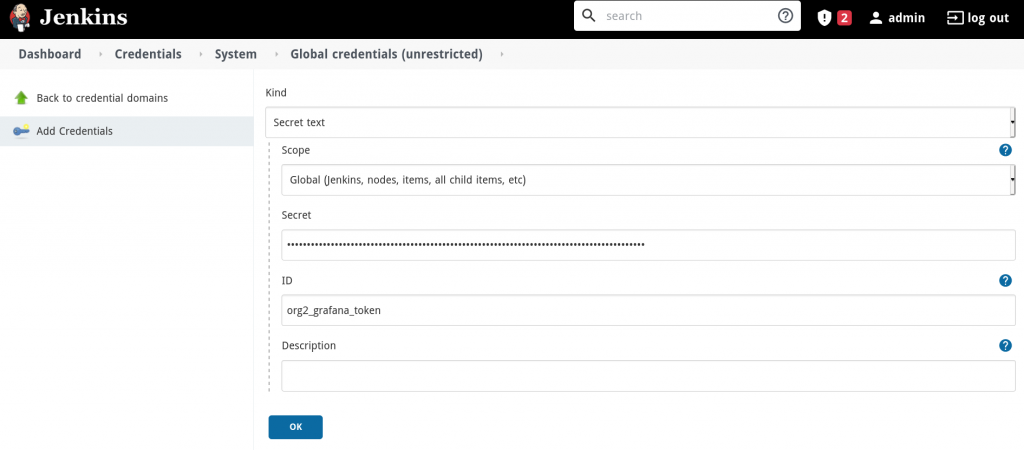
and finally, add the API tokens to the Jenkins credentials storage:
In this blog post we’ll use GitHub for git hosting, but the procedure is not bound to a particular hosting service; it will work even with a local git repository, as long as it is reachable from our Jenkins docker. In order to keep this introductory blog post simple enough, we are not using advanced , service-specific functionalities such as Webhooks or GitHub actions.
We assume that, as for Grafana, a GitHub API token is saved in the Jenkins credential storage.
Jsonnet Parametrization
One of the functionalities that Jsonnet provides that we are going to use are parametrized builds: we can pass variables or even Jsonnet code as arguments to the Jsonnet compiler to generate parametrized JSON structures.
Let’s assume that each client has created different names for the Influx database that will be the datasource for our dashboards: we want to generate JSON with a different value of the variable org_datasource for each client.
To achieve this, we can modify how we defined the dashboard in the previous blog post from
local org_datasource = "example_datasource";to an external variable, which should be passed as an argument to the compiler:
local org_datasource = std.extVar("org_datasource");and then compile as before using jsonnet and passing the org_datasource as an argument to the Jsonnet compiler:
--ext-str org_datasource="test_datasource"Pipeline Setup in Jenkins
Let’s start with the pipeline:
pipeline {
    agent any
    environment {
        ORG1_DATASOURCE = "datasource_org1"
        ORG2_DATASOURCE = "datasource_org1"
    }
As a first step, we export the variables that we want to pass to the Jsonnet compiler: ORG1_DATASOURCE and ORG2_DATASOURCE. For a more complex configuration, you might want to use a separate properties file.
As a first stage of our pipeline we’ll copy the Jsonnet binary from our file server to the Jenkins workspace.
stages{
    stage('Copy Jsonnet binary'){
        steps {
            sh "curl http://file_server:8000/jsonnet --output $WORKSPACE/jsonnet"
            sh "chmod u+x $WORKSPACE/jsonnet"
        }
    }
Next we can check out our dashboard code from our git repository. Since the dashboard written in the previous blog post needs the Grafonnet-lib jsonnet templates, we’ve included Grafonnet-lib as a git submodule in our repository. Thus we need to check out both the submodule and the main repository during the checkout stage. This is achieved by setting disableSubmodules: false, recursiveSubmodules: true in the SCM Step:
stage('Checkout code') {
    steps {
        checkout([$class: 'GitSCM', branches: [[name: '*/main']],
        extensions: [[$class: 'SubmoduleOption', disableSubmodules: false, parentCredentials: false, recursiveSubmodules: true, reference: '', trackingSubmodules: false]],
        userRemoteConfigs: [[credentialsId: 'github_api_token',
        url: 'https://github.com/***/grafana-dashboards.git']]])
    }
}
Finally, we can compile with Jsonnet and upload the JSON structures to the two different Grafana orgs. Note that the org to which the dashboard will be uploaded to depends on the Grafana token: each token is bound to a single organization in Grafana so there is no need to specify the org as a parameter. Furthermore, it makes no difference if the orgs are on the same Grafana instance or on different Grafana instances. The only thing to set accordingly is the Grafana server address in the curl command.
For passing the credentials, we will use the credentials binding plugin:
stage('Upload to Grafana for org1'){
  steps {
      sh """./jsonnet --ext-str datasource=$ORG1_DATASOURCE -J $WORKSPACE/grafonnet-lib/grafonnet/ heatmap.jsonnet > heatmap_compiled.json"""
      sh 'echo "uploading to org1"'
      sh "head -n 5 heatmap_compiled.json"
      withCredentials([string(credentialsId: 'org1_token',variable: 'GRAFANA_TOKEN')]) {
        sh '''
            set +x
            curl --fail-with-body -H "Authorization: Bearer $GRAFANA_TOKEN" -XPOST -H 'Content-Type: application/json' --data-binary @heatmap_compiled.json -i http://grafana:3000/api/dashboards/db
        '''
      }
    }
}
By default, Jenkins launches the execution shell with set -x which echoes every command. It is advisable, that when using credentials you avoid this behavior with set +x (i.e., disabling command echoing).
Inside the scope of withCredentials, we use curl with the option --fail-with-body, a recent curl option that will return a non-zero value if the HTTP response is greater than or equal to 400. We will use it to check the response status code of the API call we are making to Grafana, and to be sure that the dashboard was successfully uploaded. If this option is not available because you have an older version of curl, a Groovy script can be written to check for the return HTTP status code and return an error if it’s not 200.
-H "Authorization: Bearer $GRAFANA_TOKEN" will substitute the GRAFANA_TOKEN shell variable created by the withCredentials block with the actual token, masking it in the output (so no leaks to logs can happen).
And now, here is our full pipeline:
pipeline {
  agent any
  environment {
      GOPATH = "$WORKSPACE/go"
      PATH = "$GOPATH/bin:$PATH"
      ORG1_DATASOURCE = "datasource_org1"
      ORG2_DATASOURCE = "datasource_org1"
  }
  stages{
    stage('Copy Jsonnet binary'){
        steps {
            sh "curl http://file_server:8000/jsonnet --output $WORKSPACE/jsonnet"
            sh "chmod u+x $WORKSPACE/jsonnet"
        }
    }
    stage('Checkout code') {
        steps {
            checkout([$class: 'GitSCM', branches: [[name: '*/main']],
            extensions: [[$class: 'SubmoduleOption', disableSubmodules: false, parentCredentials: false, recursiveSubmodules: true, reference: '', trackingSubmodules: false]],
            userRemoteConfigs: [[credentialsId: 'github_api_token',
            url: 'https://github.com/***/grafana-dashboards.git']]])
        }
    }
    stage('Upload to Grafana for org1'){
        steps {
            sh """./jsonnet --ext-str datasource=$ORG1_DATASOURCE -J $WORKSPACE/grafonnet-lib/grafonnet/ heatmap.jsonnet > heatmap_compiled.json"""
            sh 'echo "uploading to org1"'
            sh "head -n 5 heatmap_compiled.json"
            withCredentials([string(credentialsId: 'org1_token',variable: 'GRAFANA_TOKEN')]) {
              sh '''
                  set +x
                  curl --fail-with-body -H "Authorization: Bearer $GRAFANA_TOKEN" -XPOST -H 'Content-Type: application/json' --data-binary @heatmap_compiled.json -i http://grafana:3000/api/dashboards/db
              '''
            }
        }
    }
    stage('Upload to Grafana for org2'){
      steps {
        sh """./jsonnet --ext-str datasource=$ORG2_DATASOURCE -J $WORKSPACE/grafonnet-lib/grafonnet/ heatmap.jsonnet > heatmap_compiled.json"""
        sh 'echo "uploading to org2"'
        sh "head -n 5 heatmap_compiled.json"
        withCredentials([string(credentialsId: 'org2_token',variable: 'GRAFANA_TOKEN')]) {
          sh '''
              set +x
              curl --fail-with-body -H "Authorization: Bearer $GRAFANA_TOKEN" -XPOST -H 'Content-Type: application/json' --data-binary @heatmap_compiled.json -i http://grafana:3000/api/dashboards/db
          '''
        }
      }
    }
  }
}
Now we can schedule the pipeline each night excluding weekends, using the Jenkins Cron syntax to run our pipeline every weekday at 8pm if there are any changes in the git repository:
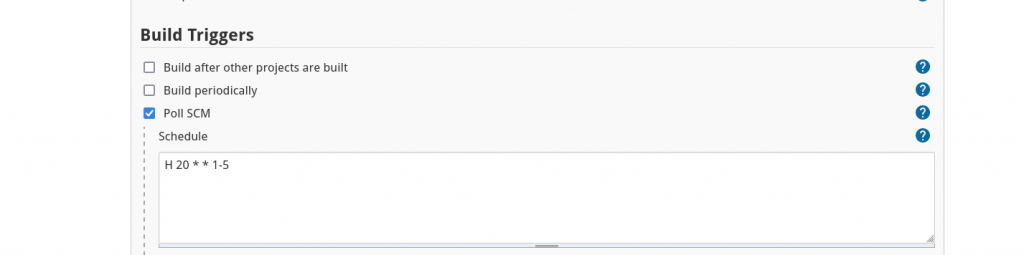
A build will be triggered only if there is a new commit in the repository.
Conclusions
In this blog post I gave you a basic idea of how Jenkins could be used, together with Jsonnet, to implement Continuous Deployment (CD) for automatically deploying parametrized multi-org Grafana dashboards.
Lorenzo Candeago
DevOps Engineer at Würth Phoenix
Author
Latest posts by Lorenzo Candeago
30. 07. 2024
DevOps
Terraform Integration with Ansible
29. 07. 2024
DevOps
include_task vs import_task in Ansible
24. 07. 2024
DevOps
How to Add SSH Keys to ArgoCD and Tekton on OpenShift to Access Gitea: Part 3 – A Simple Tekton TaskRun
17. 07. 2024
DevOps
How to Add SSH Keys to ArgoCD and Tekton on OpenShift to Access Gitea: Part2 – Add an SSH Key as a Secret to ArgoCD and Run a Test Deployment
17. 07. 2024
DevOps
How to Add SSH Keys to ArgoCD and Tekton on OpenShift to Access Gitea: Part1 – Set up the Test Environment and Add SSH Key to Gitea