
06. 07. 2021
Lorenzo Candeago
ITOA
Continuous Deployment of Grafana Dashboards Using Jsonnet and Jenkins, Part 1
Say we want to monitor the disk latency of SQL Servers or other Windows Performance Counters in a private cloud context, and plot the results for users of our performance management platform who likely work in different companies. InfluxDB, Telegraf and Grafana are the right tools to achieve this, and with the power of Flux, we can analyze the data efficiently and plot it using Grafana.
We’ll want to divide our dashboards into rows, with one row for each metric. By using Jenkins, an open source automation server, we can deploy the same dashboard for all users even though they are spread across different companies (different orgs in Grafana) and automatically update the dashboards for all clients once a new version of the dashboard is pushed to a git repository.
The versioning system should allow us to keep track of changes in the dashboards, thanks to git, and be able to immediately roll back the dashboards for all the clients if some dashboard bug is pushed into production.
Moreover, since we want to create maintainable dashboards that can be deployed for multiple organizations, we’ll need a templating language to generate the dashboard’s JSON representation. This language should be both expressive and powerful: for this we decided to use Jsonnet.
Jsonnet
Jsonnet is a JSON templating language for generating config files. It supports YAML, JSON and INI output formats, and provides useful tools such as a syntax checker and a formatter.
Grafana provides a set of Jsonnet templates (called Grafonnet) to quickly and easily write dashboards programmatically. Right now Grafonnet is still under development, and a new version of the Jsonnet templates for Grafana > 7.0 is on its way. In our running example below, we’ll use the currently available library, which is good enough for most use cases.
To begin, let’s set up the tools we’ll need to build our dashboard template: the Grafonnet library and a Jsonnet compiler. The Jsonnet compiler we use is the Go implementation, developed by Google. Be sure to set up your Go path correctly: by default the compiled binary will be placed in ~/go/bin/ .
$ git clone https://github.com/grafana/grafonnet-lib.git
$ go get github.com/google/go-jsonnet/cmd/jsonnet
For this example, we’ll assume that the Grafonnet repository is cloned in the home directory. Suppose on our dashboard we want to compute and display a heatmap of two Disk I/O metrics collected by Telegraf on an SQL server, both for reading and writing, and we want to show each metric on a separate row.
Let’s start by creating a file called heatmap.jsonnet and importing the necessary objects provided by the Grafonnet library:
local grafana = import 'grafana.libsonnet';
local dashboard = grafana.dashboard;
local template = grafana.template;
local heatmap = grafana.heatmapPanel;
Now let’s define the variables and properties that we’ll need for generating our dashboard as a nested array: in the first level we’ll have the row-related variables, and in the inner level we’ll have the metrics that should appear in each panel for each row.
local dashboard_datasource = "example_datasource"
local rows = [
  {
    row_title: 'Avg._Disk_sec/{Write,Read}',
    metrics: [
      {
        name: 'Avg._Disk_sec/Write',
        db_metric_name: 'Avg._Disk_sec/Write_bucket',
        format: 's',
      },
      {
        name: 'Avg._Disk_sec/Read',
        db_metric_name: 'Avg._Disk_sec/Read_bucket',
        format: 's',
      },
    ],
  },
  {
    row_title: 'Disk_{Writes,Reads}_persec',
    metrics: [
      {
        name: 'Disk_Writes_persec',
        db_metric_name: 'Disk_Writes_persec_bucket',
        format: 'wps',
      },
      {
        name: 'Disk_Reads_persec',
        db_metric_name: 'Disk_Reads_persec_bucket',
        format: 'rps',
      },
    ],
  }]
Let’s start defining our dashboard: this will be the root object of our Jsonnet file:
dashboard.new(
  title='Disk I/O heatmap',
  editable=true,
  graphTooltip='shared_crosshair',
  time_from='now - 3d',
  tags=['SQL-DB'])
and then add a Grafana template variable that allows us to select which host we want to plot:
.addTemplate(
  template.new(
    name='host',
    datasource=dashboard_datasource,
    query=|||
      import "influxdata/influxdb/schema"
      schema.tagValues(
        bucket: v.defaultBucket,
        tag: "host",
        predicate: (r) => true,
        start: v.timeRangeStart
      )
    |||,
    hide='',
    allValues=null,
    current='all',
    refresh='load',
    includeAll=true,
    multi=true,
  )
)
(Notice that this query will only work with Influx >= 2.0. For previous versions of Influx there are other workarounds.)
Thanks to the looping capability we can now iterate over the previously defined variable rows and create all the dashboards we need by defining a single heatmap panel:
.addRows([
  row.new(title=r.row_title)
  .addPanels(
    [
      heatmap.new(
        title=metric.name,
        yBucketBound='upper',
        dataFormat='tsbuckets',
        hideZeroBuckets=true,
        yAxis_format=metric.format,
        yAxis_decimals=0,
        tooltipDecimals=2
      )
      .addTarget(
        grafana.influxdb.target(
          query=|||
          from(bucket: v.bucket)
             |> range(start: v.timeRangeStart , stop: v.timeRangeStop)
             |> filter(fn: (r) => r["_measurement"] == "PhysicalDisk")
             |> filter(fn: (r) => r["host"] =~ /${host:regex}/)
             |> filter(fn: (r) => r["_field"] == "%(metric)s")
             |> filter(fn: (r) => r["instance"] != "_Total")
             |> yield()
          ||| % {metric: metric.metric_name}
        )
      )
      for metric in r.metrics
    ]
  for r in rows
])
As we can see, the addRows function requires an array of row objects as argument. For each row object we call the addPanels method that takes an array of heatmap panels as its argument in turn.
Each heatmap panel has a target query to retrieve the data, defined in the addTarget method. Notice that we are using both the Grafana template variables in the query (/${host:regex}/) and Jsonnet’s Python-like string manipulation capabilities ("%(metric)s" ... ||| % {metric: metric.metric_name}).
Now that we’ve defined our dashboard, we can first auto-format it for more tidy code and then compile it to JSON. Since we are including functions from the Grafonnet library, we need to pass the previously cloned Grafonnet repository as an argument to the Jsonnet compiler.
$ jsonnetfmt heatmap.jsonnet > heatmap_formatted.jsonnet
$ jsonnet -J ~/grafonnet-lib/grafonnet/ heatmap_formatted.jsonnet > heatmap_compiled.json
At this point we have a JSON string as output that can be manually imported into Grafana using the import button.
Grafana Dashboard API
What we want next is to be able to import the dashboard using the Grafana dashboard API. To achieve this we’ll need two things: first, in terms of how the API is defined, we need to include all the previous JSON results under a root node called dashboard, and add another JSON key, overwrite, that as the name says, will allow us to override the dashboard if it already exists.
The first point is easily achieved either by using jq
jq -c '{"overwrite": true, dashboard": .}' heatmap_compiled.json > heatmap_for_dashboard_api.jsonor, more correctly, by modifying heatmap.jsonnet and adding a root node named dashboard and the overwrite property:
{"overwrite": true,
 "dashboard":
    dashboard.new(
    ...
}
Here we can see the full dashboard Jsonnet code:
local grafana = import 'grafonnet/grafana.libsonnet';
local dashboard = grafana.dashboard;
local template = grafana.template;
local heatmap = grafana.heatmapPanel;

local rows = [{...}]

{"overwrite": true,
 "dahsboard":
    dashboard.new(
      title='Disk I/O heatmap',
      editable=true,
      graphTooltip='shared_crosshair',
      time_from='now - 3d',
      tags=['SQL-DB']
    )
    .addTemplate(
      template.new(
        name='host',
        datasource=dashboard_datasource,
        query=|||
          import "influxdata/influxdb/schema"
          schema.tagValues(
            bucket: v.defaultBucket,
            tag: "host",
            predicate: (r) => true,
            start: v.timeRangeStart
          )
        |||,
        hide='',
        allValues=null,
        current='all',
        refresh='load',
        includeAll=true,
        multi=true,
      )
    )
    .addRows([
      row.new(title=r.row_title)
      .addPanels([
          heatmap.new(
            title=metric.name,
            yBucketBound='upper',
            dataFormat='tsbuckets',
            hideZeroBuckets=true,
            yAxis_format=metric.format,
            yAxis_decimals=0,
            tooltipDecimals=2
          )
          .addTarget(
            grafana.influxdb.target(
              query=|||
              from(bucket: v.bucket)
                |> range(start: v.timeRangeStart , stop: v.timeRangeStop)
                |> filter(fn: (r) => r["_measurement"] == "PhysicalDisk")
                |> filter(fn: (r) => r["host"] =~ /${host:regex}/)
                |> filter(fn: (r) => r["_field"] == "%(metric)s")
                |> filter(fn: (r) => r["instance"] != "_Total")
                |> yield()
              ||| % {metric: metric.metric_name}
            )
        ) for metric in r.metrics]
    for r in rows])
}
Now let’s generate an API key in Grafana:
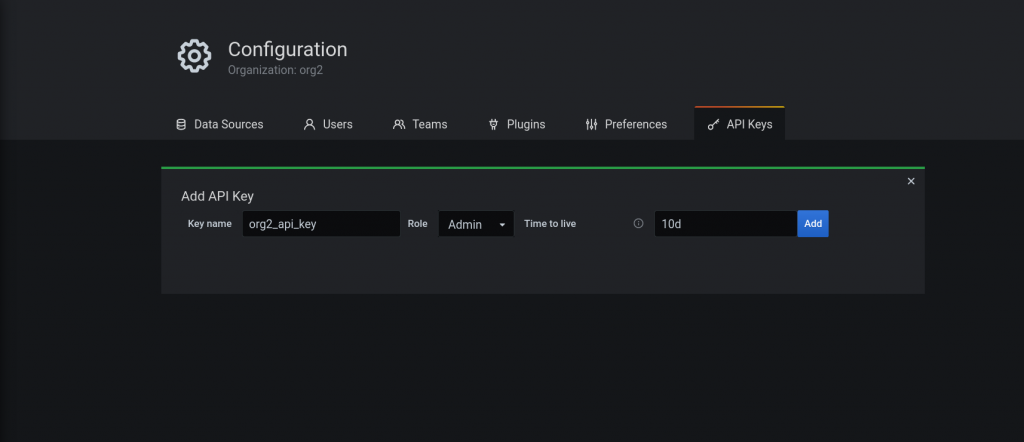
Finally, using a curl request we can now finally upload the compiled dashboard JSON:
$ curl -H "Authorization: Bearer eyJrIjoidGdqUDdU..." -X POST -H 'Content-Type: application/json' --data-binary @heatmap_for_dashboard_api.json -i http://localhost:3000/api/dashboards/dbConclusion
In this blog post we showed how to write a dashboard-as-code using Jsonnet and how to upload it to Grafana using the Grafana API. In the next blog post I’ll explain how to further improve dashboard deployment using Jenkins and show how to implement continuous deployment (CD) for multi-org Grafana instances.
Lorenzo Candeago
DevOps Engineer at Würth Phoenix
Author
Latest posts by Lorenzo Candeago
30. 07. 2024
DevOps
Terraform Integration with Ansible
29. 07. 2024
DevOps
include_task vs import_task in Ansible
24. 07. 2024
DevOps
How to Add SSH Keys to ArgoCD and Tekton on OpenShift to Access Gitea: Part 3 – A Simple Tekton TaskRun
17. 07. 2024
DevOps
How to Add SSH Keys to ArgoCD and Tekton on OpenShift to Access Gitea: Part2 – Add an SSH Key as a Secret to ArgoCD and Run a Test Deployment
17. 07. 2024
DevOps
How to Add SSH Keys to ArgoCD and Tekton on OpenShift to Access Gitea: Part1 – Set up the Test Environment and Add SSH Key to Gitea